

IBIT ETF analysis with price trend, technicals, analyst views, risks, earnings context, and a balanced buy-or-watchlist conclusion.
Data as of April 20, 2026, 8:53 AM PKT. Latest market data used is from the last available close on Apr 17, 2026, unless noted otherwise.
Introduction
The IBIT ETF is the iShares Bitcoin Trust ETF, a fund built to track the price of bitcoin. It gives investors direct bitcoin exposure without needing to hold the asset themselves.
Investors are focused on the IBIT ETF because bitcoin remains highly sensitive to liquidity, risk appetite, and crypto market sentiment. That makes the fund relevant when tech and speculative assets move together or when investors rotate toward risk assets.
Latest etf Price & Trend
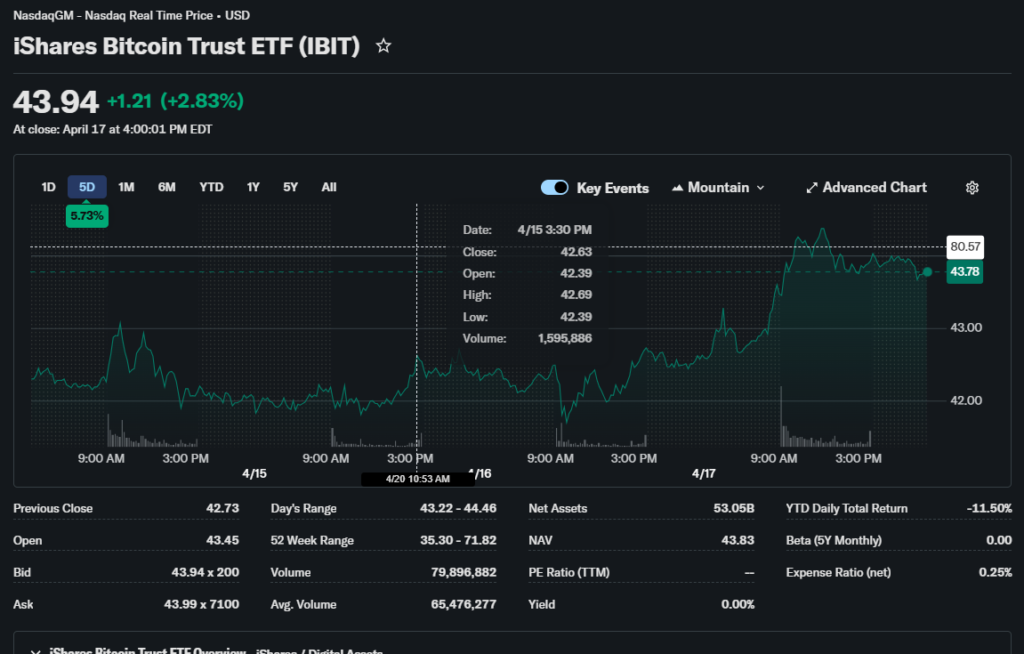
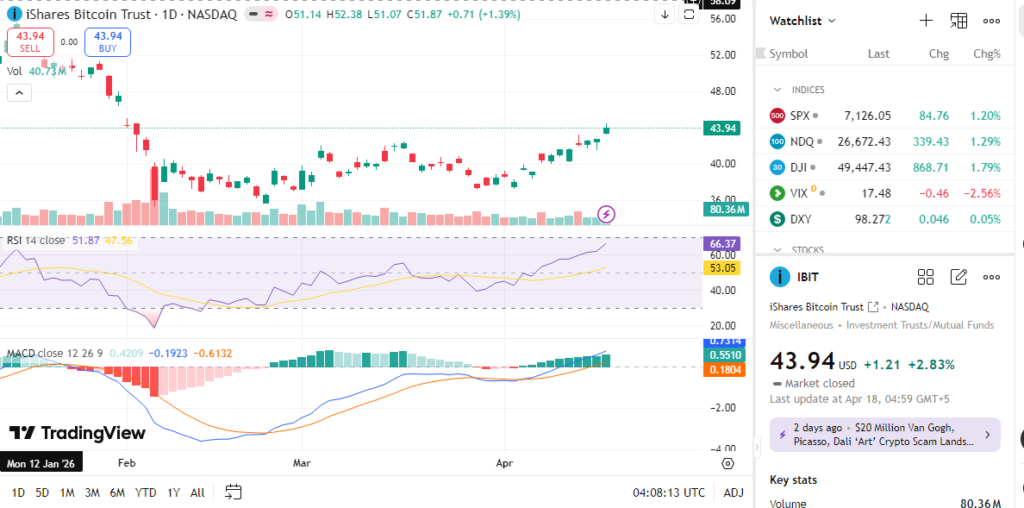
The latest reported IBIT ETF price was $43.94 on Apr 17, 2026, while Robinhood showed a more recent intraday quote of $43.79 with a daily range between $42.69 and $44.46 on Apr 19, 2026. The one-day move on the Apr 18 session was shown as a small decline, and the fund remained close to its recent trading range.
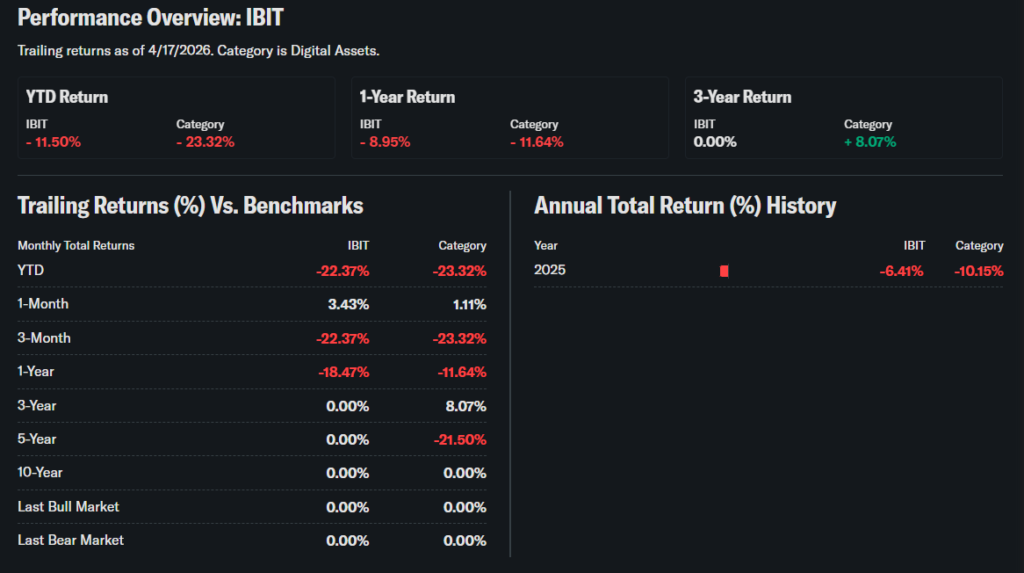
Over the past 5 days, the pattern appears choppy but stable near the low-to-mid $40s, which suggests consolidation rather than a strong breakout. The 1-month, 3-month, and 6-month trends are best described as mixed to bearish relative to the 52-week high, because the fund is still far below its peak.
The 52-week high is $71.82, and the 52-week low is $35.30. Year to date, the price sits well below the high, but above the low, which points to a sideways to mildly bearish broader trend. For investors, that usually means the ETF is still driven more by bitcoin sentiment than by steady fund-level fundamental.

Technical Analysis
Support is the price area where buyers have recently stepped in. For IBIT, the short-term support area is near the recent low around $42.69, while the broader support reference from market commentary sits closer to the low-to-mid $40s.stockinvest+1
Resistance is the level where selling pressure often appears. The recent intraday high near $44.46 is the nearest short-term resistance, while the 52-week high of $71.82 is the major longer-term ceiling.
RSI means Relative Strength Index. It helps show whether an asset may be overbought or oversold, but a current verified RSI reading was not available from the sources used here. MACD, moving averages, and golden-cross or death-cross signals were also not directly reported in the verified source set, so they should not be stated as facts here.
Trading volume was not clearly reported in the available source excerpts, so the safest conclusion is that IBIT’s technical picture looks range-bound rather than strongly trending. That matters because bitcoin-linked products often need strong volume and momentum to sustain rallies.

Analyst Ratings & Price Targets
Traditional analyst ratings are limited for IBIT because it is a bitcoin trust, not a normal operating company with earnings forecasts. That means there is no standard Buy, Hold, or Sell consensus from Wall Street firms in the usual sense.
As a result, price targets are also not commonly provided in the same way they are for stocks. Some third-party sites show speculative forecast ranges, but those are not the same as institutional analyst targets and should be treated cautiously.
For investors, the lack of standard coverage means sentiment is driven more by bitcoin outlook, ETF flows, and macro conditions than by analyst revisions. In other words, IBIT ETF earnings expectations are not the main valuation driver because the fund does not operate like a company with quarterly revenue and EPS.
Insider Activity
There is no meaningful insider buying or selling framework for IBIT in the way investors track company insiders. The fund is a trust structure, so management share transactions are not the same as insider trades in an operating business.
That means large insider purchases or sales are not a useful signal here. Investors should focus instead on fund flows, bitcoin custody structure, premium or discount behavior, and overall crypto market demand.
Valuation Analysis
Traditional valuation ratios like trailing P/E, forward P/E, and price-to-sales do not apply in the normal way to IBIT, because it is not an operating company. Fidelity also showed a P/E ratio of 0, which is consistent with the fund structure.
Revenue growth, EPS growth, and free cash flow are also not meaningful operating metrics for IBIT itself. Debt and cash comparisons are likewise not central, since the ETF is designed to hold bitcoin and mirror its price.
Compared with companies like Microsoft or Zoom, this is a very different investment case. Microsoft is judged on earnings, cash flow, and margins, while IBIT is judged on bitcoin price behavior and investor demand. On that basis, the fund is neither cheaply nor expensively valued in a normal corporate sense; it is better described as a pure exposure vehicle.
Recent Earnings & Catalysts
IBIT does not report earnings like a company, so there are no quarterly revenue beats, EPS beats, or guidance updates in the traditional sense. That means “latest quarterly results” is not a suitable framework for this ETF.
The main catalysts are bitcoin price moves, ETF inflows, macro liquidity, and crypto regulation sentiment. Premium and discount levels also matter, and iShares showed a premium/discount figure of 0.26 as of April 20, 2026, which suggests the fund was trading close to its underlying value.
For investors, the key question is not whether IBIT ETF earnings beat estimates. The real question is whether bitcoin demand remains strong enough to support the fund’s price and trading volume.
Bullish Case
The bullish case for the IBIT ETF starts with simple access to bitcoin through a regulated fund structure. That can attract investors who want crypto exposure without wallet management or direct custody risk.
The fund also benefits when risk appetite improves and capital rotates into speculative assets. If bitcoin adoption, ETF inflows, or macro liquidity improve, IBIT can move sharply higher because it tracks the underlying asset closely.
Another positive factor is operational simplicity. The ETF structure makes it easy for both retail and institutional investors to buy exposure through a standard brokerage account.
Bearish Case
The biggest risk is bitcoin volatility. If bitcoin falls, the IBIT ETF price usually falls with it.
Regulatory uncertainty is another concern, especially if policy changes affect crypto markets, custody rules, or investor access. The ETF also faces sentiment-driven pullbacks, because it does not have earnings support, dividends, or cash flow to cushion losses.
There is also competition from other bitcoin products and broader market substitutes. In weak markets, investors may prefer cash, bonds, or profitable tech stocks over a pure crypto exposure vehicle.
Market Sentiment & Investor Psychology
Short interest data was not available in the verified source set, so it should not be estimated here. Options activity was also not confirmed in the sources used.
Institutional ownership is important for IBIT, but the more useful indicator is fund demand and assets under management rather than classic ownership ratios. Retail investors often treat IBIT as a bitcoin proxy, so momentum can build quickly when crypto sentiment turns positive.
Overall sentiment looks neutral to cautious based on the current price being far below the 52-week high. That suggests investors are waiting for clearer bitcoin direction before committing more aggressively.

Short-Term Outlook
In the next days and weeks, IBIT will likely follow bitcoin’s direction closely. The recent trading range near the low $40s suggests the market is still searching for a clearer trend.
If bitcoin strengthens, the ETF can rebound quickly because of its direct exposure structure. If risk sentiment weakens, the recent support area near the low $40s may be tested again.
Medium To Long-Term Outlook
Over 6 to 24 months, the outlook depends on bitcoin adoption, macro liquidity, and investor comfort with crypto exposure. IBIT is structurally strong as an access product, but it is still tied to a highly volatile asset.
For long-term investors, the fund is best viewed as a watchlist or selective accumulation idea, not a core low-risk holding. Investors who already want bitcoin exposure may use it as a convenient vehicle, but position sizing matters because drawdowns can be large.
FAQ Section
Is IBIT ETF a buy right now?
It can be a buy for investors who want direct bitcoin exposure through an ETF, but it is not a low-risk purchase. The decision depends on your view of bitcoin, not traditional earnings strength.
What is the price target for IBIT ETF?
There is no standard Wall Street price target framework for IBIT like there is for operating companies. Third-party forecasts exist, but they should not be treated as official analyst targets.
What are the major risks for IBIT ETF?
The main risks are bitcoin volatility, regulatory changes, and sentiment-driven selling. The ETF also lacks earnings and cash flow support.
Does IBIT ETF pay dividends?
No verified source in this set indicates dividend income, and the fund is designed to track bitcoin rather than generate operating earnings.
What drives IBIT ETF performance?
Bitcoin price, ETF inflows, market liquidity, and investor risk appetite are the main drivers.
Suggestions
- Compare with Zoom ETF-style growth risks.
- See our Microsoft ETF forecast for a cash-flow contrast.
- Read our tech sector valuation breakdown for a broader market context.
Conclusion
The IBIT ETF is a strong access product for bitcoin exposure, but it remains highly volatile and sentiment-driven. Based on the current trend, the most balanced view is Watchlist for cautious investors and selective accumulation for those already bullish on bitcoin.
Disclaimer: This article is for informational purposes only and not financial advice.