

MSTU ETF analysis with price trend, technical analysis, earnings drivers, risks, analyst sentiment, and long-term outlook for investors.
Data as of April 20, 2026, 11:59 AM PKT. Last market close data used where noted.
Introduction
The MSTU ETF is the T-REX 2X Long MSTR Daily Target ETF. It aims to deliver 2X the daily performance of Strategy Inc. (MSTR), formerly MicroStrategy. That makes the MSTU ETF a leveraged trading tool, not a traditional long-term index fund.
Investors are focused on the MSTU ETF because its value is tied closely to MSTR, which itself is influenced by Bitcoin sentiment and Strategy’s corporate updates. In a volatile tech and crypto-linked market, that creates sharp daily moves and fast reversals. The MSTU ETF is mainly used by traders who want amplified exposure for a short holding period.
MSTU ETF Price & Trend
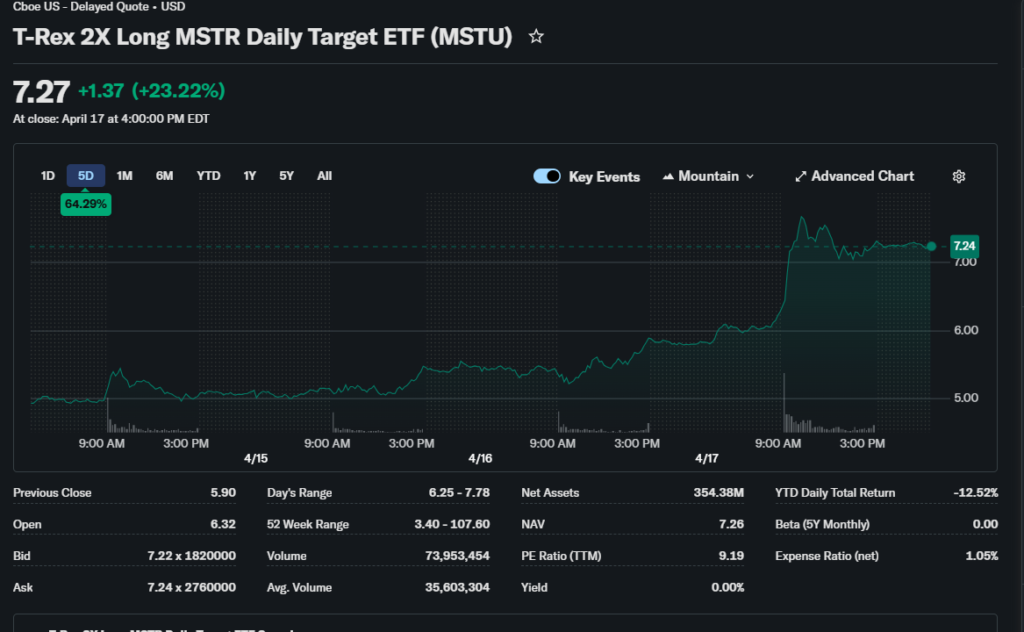
As of the latest market snapshot, the MSTU ETF price was $7.24. On the same session, it traded between $5.97 and $7.78, with volume of 74.72 million shares versus a 36.79 million daily average. That suggests unusually strong trading interest.
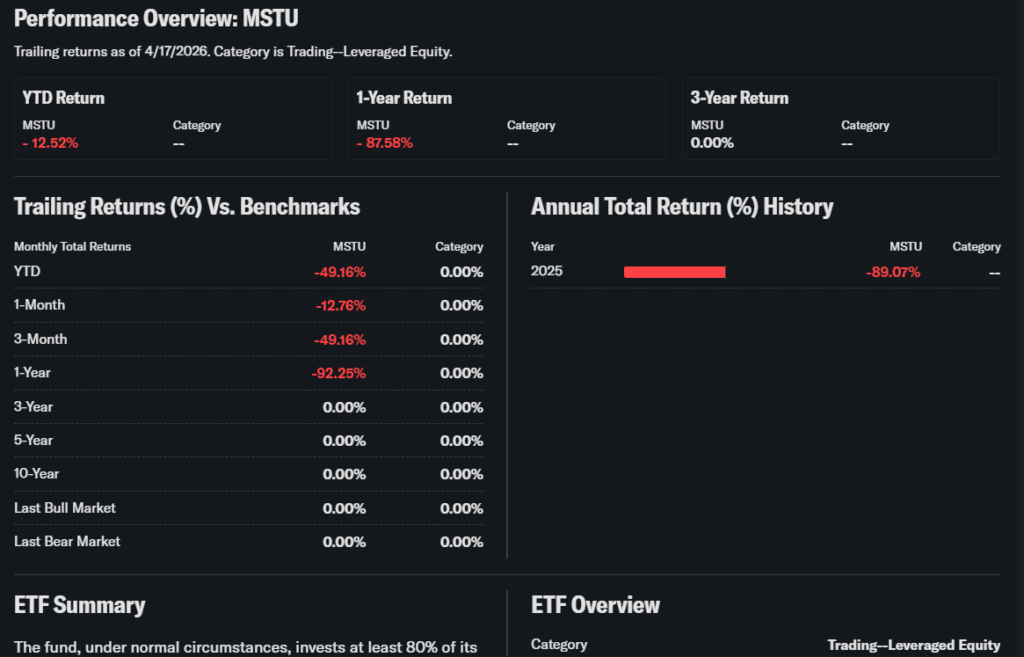
The MSTU ETF showed a very wide 52-week range from $3.40 to $107.60. Recent third-party data also shows sharp drawdowns over one-month and three-month periods, reflecting heavy volatility. Overall, the MSTU ETF trend looks bearish to highly volatile, even though short bursts of strength can appear quickly.
For investors, that trend means the MSTU ETF is sensitive to fast changes in MSTR and broader risk appetite. It is not designed to track a steady long-term path. The latest move says momentum traders are active, but the swing risk remains high.

Technical Analysis
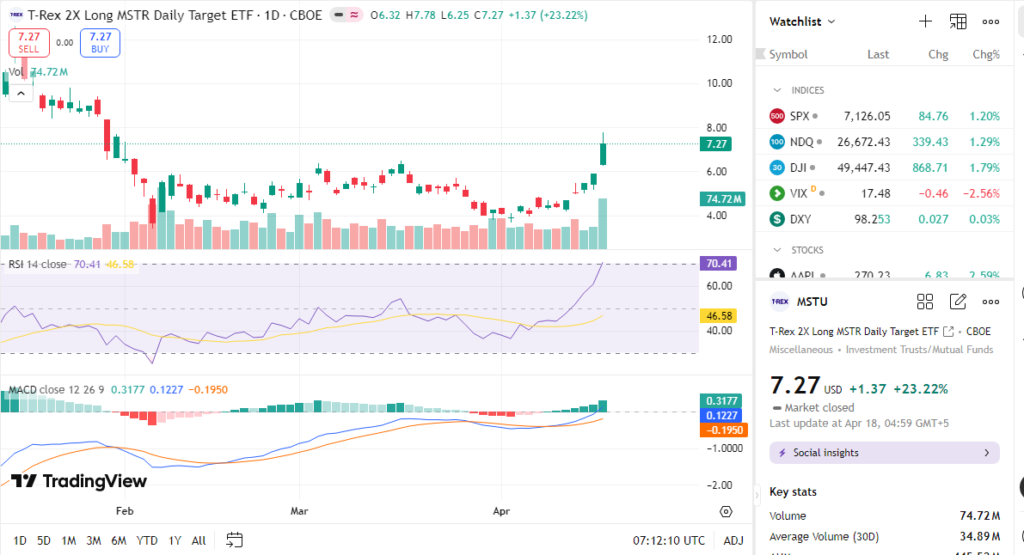
The most recent technical snapshot shows the 50-day moving average near $5.72, while the 200-day moving average was around $7.49. When price sits below the 200-day average, that usually signals a weaker medium-term trend. A 20-day average near $4.99 also pointed to softness in shorter momentum.
The RSI reading was reported near 60.72 in one technical feed and 44.37 in another, depending on the source date. RSI above 70 often suggests overbought conditions, while below 30 suggests oversold conditions. These readings imply the MSTU ETF was not deeply oversold at the time of those reports.
The MACD was slightly negative at -0.07 in one report, which leans bearish. Support levels were near recent lows around $5.97 and then the broader 52-week low near $3.40. Resistance was near $7.78, then the 50-day and 200-day moving averages. Volume running above average usually confirms that traders are paying attention.

Analyst Ratings & Price Targets
Traditional analyst ratings are limited for the MSTU ETF itself because it is a leveraged fund, not an operating company. ETF research platforms instead focus on the underlying exposure and technical profile. That means there are no standard Buy, Hold, and Sell counts like a normal stock would have.
For a practical view, analysts are really expressing views on MSTR rather than the MSTU ETF. Since MSTU seeks 2X daily exposure, analyst sentiment on MSTR matters indirectly and more aggressively. In plain terms, bullish views on MSTR can help MSTU for a trading window, but the leverage also cuts both ways.
That makes the MSTU ETF price target concept less useful than it is for stocks. Traders should focus on volatility, trend, and timing instead of a long-term fair-value target. The sentiment around this fund is therefore better described as trader-driven, not consensus-rated.
Insider Activity
Insider activity is not very meaningful for the MSTU ETF because ETFs do not have corporate insiders in the same way operating companies do. The fund’s issuer can change fund mechanics, but that is different from insider buying or selling. So there is no standard insider accumulation signal to read here.
The more relevant activity is in the underlying exposure, Strategy Inc.. If Strategy management is active with capital raises, Bitcoin purchases, or strategy shifts, that can move sentiment for MSTR and therefore the MSTU ETF. For MSTU, those corporate actions matter more than fund-level insider transactions.
Valuation Analysis
The MSTU ETF does not have a normal P/E ratio, price-to-sales ratio, or EPS profile like an operating company, because it is a leveraged ETF. It also does not report revenue growth, free cash flow, or debt in the usual company sense. Those figures belong to the underlying business, not the ETF wrapper.
A better valuation lens is the underlying exposure and fund structure. MSTU charges a 1.05% expense ratio and seeks 200% daily exposure to MSTR. That means performance depends more on direction and volatility than on intrinsic value.
Against the broader market, the MSTU ETF is not a value vehicle. It is best viewed as a tactical instrument with leverage decay risk over time. On valuation grounds, it is neither clearly undervalued nor overvalued; it is simply a leveraged exposure product.
Recent Earnings & Catalysts
The MSTU ETF does not report quarterly earnings itself. Its performance is driven by Strategy Inc. results, Bitcoin-related headlines, and market volatility around those events. That is why searches for MSTU ETF earnings usually point back to MSTR earnings.
Recent catalyst risk includes Strategy’s earnings, Bitcoin accumulation updates, financing activity, and market reactions to those disclosures. The fund prospectus also notes that MSTR’s price can move sharply on earnings surprises, analyst estimate changes, and capital-raising announcements. Those events can quickly change the MSTU ETF price.
For traders, this means earnings season can create opportunity, but also gap risk. A positive MSTR surprise can help MSTU sharply in the short run. A disappointment can punish the fund just as quickly.
Bullish Case
The bullish case for the MSTU ETF starts with strong momentum in the underlying name. If Strategy stock rises quickly, the 2X structure can magnify that move on a daily basis. That can make the fund attractive during strong trend periods.
Another positive factor is active trading interest. The latest volume was well above average, which suggests high liquidity and strong participation. In a fast-moving market, that can help traders enter and exit more easily.
The fund also benefits when MSTR is in a clean uptrend and volatility is directional rather than choppy. In that setting, daily leverage can work in the trader’s favor. That is the main reason some investors watch the MSTU ETF forecast closely.
Bearish Case
The biggest risk is volatility decay. Because MSTU resets daily, longer holding periods can produce results that differ sharply from simple 2X exposure. In a choppy market, that can hurt returns even when the underlying asset does not move much.
Another risk is concentration. The fund is tied to one underlying stock and one theme. That means weakness in MSTR, Bitcoin, or tech sentiment can hit the MSTU ETF hard.
The prospectus also warns about leverage, counterparty risk, liquidity risk, and the chance of total loss in extreme one-day moves. For cautious investors, those are major weaknesses. This is why the MSTU ETF is not suitable for every portfolio.
Sentiment And Positioning
Short interest is not typically the right lens for this ETF, but sentiment can still be inferred from trading volume and volatility. The heavy volume suggests active speculation rather than passive ownership. That usually points to short-term trader interest.
Options activity is relevant because the issuer notes that the fund may use options and the underlying name has weekly and monthly options availability. That often increases attention from tactical traders. Institutional ownership trends are less useful here than in normal stocks, because leverage products are used differently.
Overall sentiment looks neutral to optimistic for short-term traders, but cautious for long-term holders. Retail behavior tends to chase momentum in products like this. That can push the fund higher quickly, then reverse just as fast.

Short-Term Outlook
In the next few days or weeks, the MSTU ETF forecast depends mostly on MSTR’s direction and market volatility. Technicals show mixed momentum, with price below the 200-day average and volume elevated. That combination often signals an unstable setup rather than a clean trend.
If MSTR rallies strongly, MSTU can move faster because of leverage. If the underlying stalls or whipsaws, performance can weaken quickly. The short-term outlook is therefore tactical, not predictable.
Medium To Long-Term Outlook
Over 6 to 24 months, the MSTU ETF is more of a trading vehicle than a buy-and-hold investment. The daily reset feature makes long holding periods less reliable. That is the core challenge for anyone asking, Is MSTU ETF a buy for the long run.
For investors who want direct, sustained exposure to the Strategy theme, the fund may still be useful in small, actively managed positions. But the structure works best when monitored closely. In a long-term portfolio, risk control matters more than headline upside.
The overall long-term view is watchlist or tactical hold, not a core allocation. That is especially true when the market is volatile and the underlying stock is moving sharply. The MSTU ETF is best treated as a short-duration instrument.
FAQ
Is MSTU ETF a buy right now?
It can fit short-term traders, but it is not ideal for passive investors. The daily leverage makes timing very important.
What is the MSTU ETF price target?
There is no standard long-term price target for a leveraged ETF like this. Traders should focus on trend and volatility instead.
What are the biggest risks?
The main risks are leverage decay, volatility, concentration, and counterparty exposure. A sharp drop in MSTR can hurt MSTU quickly.
What drives MSTU ETF earnings?
The fund itself does not report earnings. The real driver is Strategy Inc. earnings and related market reactions.
What is the MSTU ETF technical analysis telling investors?
The latest signals show mixed to weak medium-term momentum, with price below the 200-day average. That usually means caution until trend strength improves.
Internal Links
- Compare with Strategy ETF alternatives.
- See our Bitcoin-linked ETF forecast.
- Read our leveraged ETF risk guide.
Conclusion
The MSTU ETF is a high-risk, high-volatility trading tool tied to Strategy Inc. and daily leverage. It can work well in strong directional moves, but it is vulnerable to compounding drag and sharp reversals. My balanced call is Watchlist, with a trading-only mindset rather than a long-term buy-and-hold approach.
Disclaimer: This article is for informational purposes only and not financial advice.