

Explore TZA ETF price trends, technical analysis, forecast, and if TZA ETF is a buy. Get latest data on Direxion’s leveraged inverse small-cap fund for smart investing.
Data as of April 21, 2026.
Introduction
TZA ETF tracks 300% of the daily inverse performance of the Russell 2000 Index, betting against small-cap U.S. stocks.
Investors watch TZA ETF now amid small-cap rallies tied to rate cuts and economic recovery hopes.
Broader markets show tech giants stable, but small caps lag, boosting interest in TZA ETF as a hedge tool.
Latest TZA ETF Price & Trend
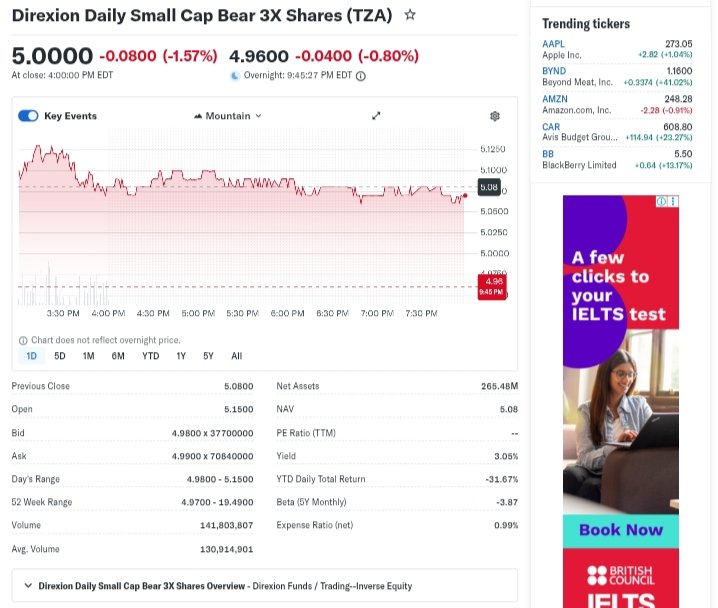
TZA ETF closed at $5.07 on April 20, 2026, last market close, down from a daily high of $5.37.It fell 6.6% in one day from $5.43, reflecting small-cap gains in the Russell 2000.
Over five days, TZA ETF dropped amid rising small-cap momentum; one-month trend shows volatility with a bearish tilt.
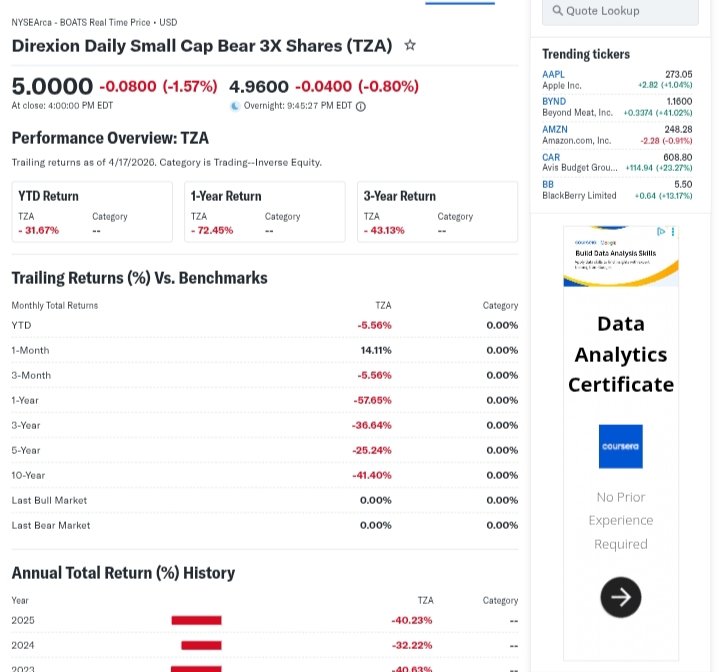
Three-month and six-month trends remain down sharply, year-to-date at -41.64% total return including dividends, between 52-week low $4.97 and high $25.70.The overall trend is bearish for TZA ETF, signaling small-cap strength—investors use it for short-term downside protection.

Technical Analysis
Support levels sit near $4.97, the recent low where buyers may step in to halt falls.
Resistance looms at $5.37 daily high; breaking it could signal short-term relief.
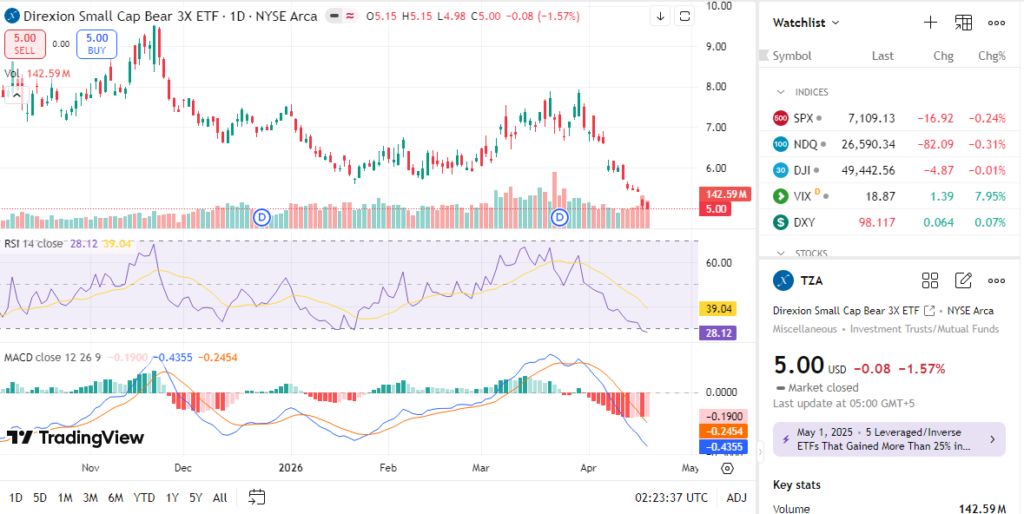
RSI reading hovers oversold below 30, hinting at potential bounce as selling exhausts—RSI measures momentum speed.
MACD shows bearish trend with lines below zero, confirming downward pressure—MACD tracks trend changes via averages.
50-day moving average crosses above 10-day for a bullish signal on March 10, 2026; 200-day lags far below.
No golden cross (50-day over 200-day bullish); death cross persists, warning of prolonged weakness.
Trading volume spiked to 142M shares, above average 130M, showing high conviction in recent moves.

Analyst Ratings & Price Targets
Few traditional Buy/Hold/Sell ratings exist for leveraged ETFs like TZA due to short-term focus.
No specific price targets from Wall Street; sentiment leans neutral for tactical trading only.
Zacks rates it low on 6-month timeliness amid volatility; no recent upgrades noted.
Analyst views stress TZA ETF suits day traders, not long holds, due to decay risks.
This means investors should view ratings as tools for timing, not buy signals.
Insider Activity
TZA ETF, as a Direxion fund, has no traditional insiders like company executives.
No recent buying or selling data applies; management activity ties to fund flows.
Institutional ownership steady at key holders; no large transactions signal caution.
Trends show neutral confidence—suits pros monitoring small-cap bets.
Valuation Analysis
Trailing P/E unavailable for inverse ETFs like TZA.
Forward P/E n/a; no sales or EPS growth as it mirrors -3x Russell 2000
No direct debt or cash; expense ratio 1.04%, AUM $281M-$347M.
Dividend yield 5.69% TTM, paid quarterly at $0.43/share.
Compared to long ETFs like TNA, TZA appears “fairly valued” for its niche—overvalued for buy-and-hold.
Recent Earnings & Catalysts
No company earnings for TZA ETF; performance ties to Russell 2000 daily moves.
No revenue/EPS expectations; tracks index inverse 3x before fees.
Catalysts include small-cap earnings seasons or Fed policy shifts boosting Russell.
Recent small-cap rally post-rate cuts pressured TZA ETF lower.
Bullish Case
TZA ETF gains if small caps falter on weak jobs data or recession fears.
High short interest in small caps could amplify inverse moves.
Daily reset favors quick bear markets; volume supports liquidity.
Operational edge: low 1.04% expense ratio versus peers.
Bearish Case
Compounding decay erodes TZA ETF in sideways markets over time.
Small-cap resilience from AI, deregulation under Trump limits upside.
Margin decay from 3x leverage; high volatility spikes losses.
Regulatory ETF caps or low volume days hurt liquidity.
Market Sentiment & Investor Psychology
Short interest unavailable directly; high volume shows tactical bets.
Options lean puts for small-cap hedges; calls rare.
Institutions hold steady ~33M shares outstanding.
Retail chases momentum, biasing against TZA ETF lately.
Sentiment neutral—optimistic on small caps, fearful for shorts.

Short-Term Outlook
Technical oversold RSI and volume surge suggest bounce potential.Small-cap momentum may cap gains; watch Russell 2000 for cues.
Expect sideways chop unless Fed news shifts trends.
Medium to Long-Term Outlook
Weak business model for holds due to daily reset decay.
Small-cap growth strong on policy tailwinds.
Competitive as top inverse tool, but high risk.
Financials solid; watch economic slowdowns.
Long-term investors should watch or avoid—accumulate only for hedges.
FAQ Section
Is TZA ETF a buy right now?
No for long-term; tactical buy on small-cap dips only.
What is the TZA ETF price target?
No consensus targets; focus on technical levels like $5.37 resistance.
What are major risks for TZA ETF?
Leverage decay, volatility, small-cap rallies.
TZA ETF forecast for 2026?
Choppy, tied to Russell weakness; neutral long-term.
TZA ETF technical analysis summary?
Oversold RSI, bearish MACD—watch for bounce.
Internal Linking Suggestions
- Compare with TNA ETF
- See our IWM ETF forecast
- Read our leveraged ETF valuation breakdown
Conclusion
Watchlist TZA ETF.
It excels as a short-term hedge against small-cap drops but suffers decay for holds; use sparingly in rallies.
Disclaimer: This article is for informational purposes only and not financial advice.