

Explore EFA ETF price, performance trends, technical analysis, and forecast. Learn if EFA ETF is a buy for international diversification using latest data
Introduction
The EFA ETF tracks large- and mid-cap stocks in developed markets outside the US and Canada. It follows the MSCI EAFE Index, covering Europe, Australasia, and the Far East.
Investors eye EFA ETF now for diversification amid US market highs. Global growth in Europe and Asia draws attention. Broader conditions like yen strength and EU recovery impact EFA ETF price.
Latest EFA ETF Price & Trend
EFA ETF closed at $105.24 on the last market session. It saw a 0.52% gain over the prior day amid steady volume. The 5-day trend shows a 0.52% rise, reflecting short-term stability above recent averages.
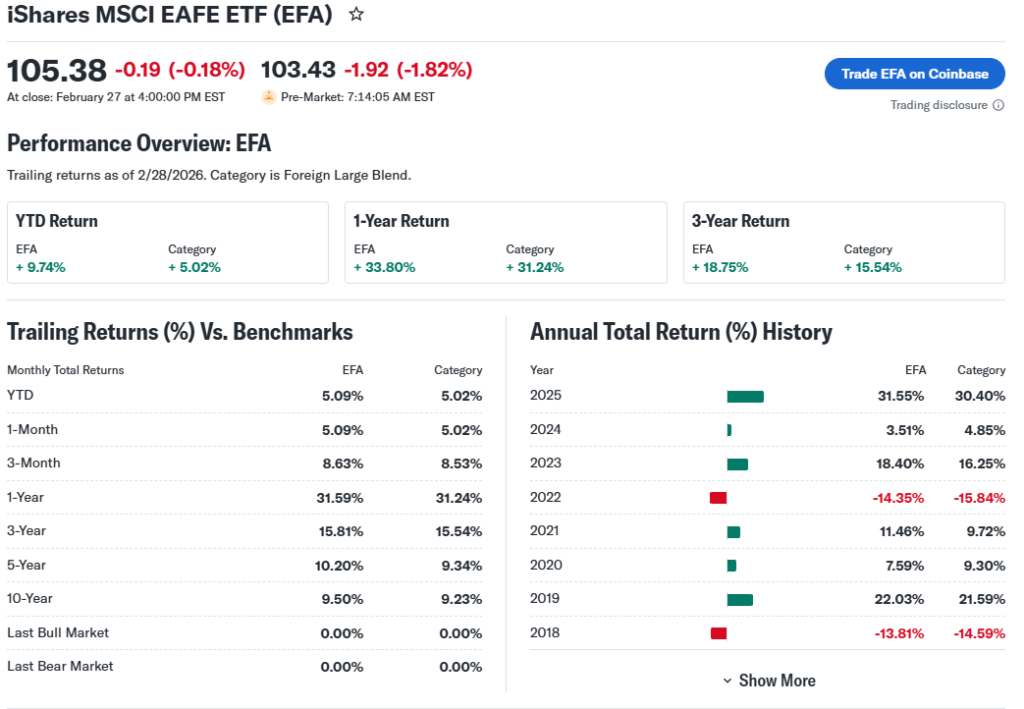
Over one month, EFA ETF price climbed about 3.58%, beating some benchmarks. The 3-month gain hit 4.61%, while 6-month performance reached 13.78% from August lows. Year-to-date in 2026, it advanced 9.11% from $96.51.

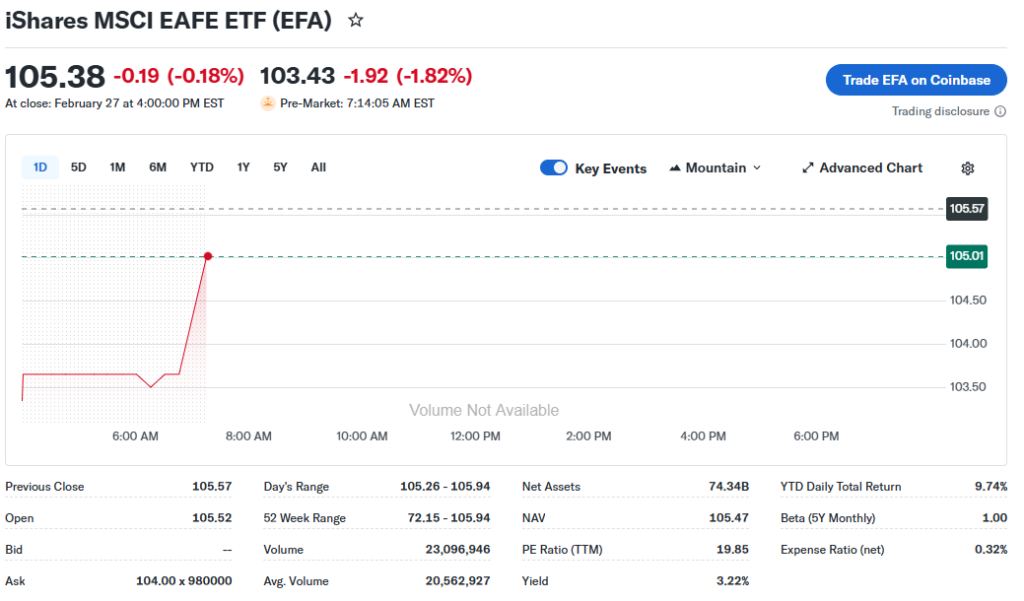
The 52-week range spans $72.15 low to $105.94 high, near the top now. Overall trend looks bullish with consistent gains. This signals strength for investors seeking international exposure, though volatility lingers from global events.
Technical Analysis
Support levels sit at $103.27, a key floor where buyers may step in. Resistance looms at $106.05; breaking it could spark more upside. These levels matter as they show where price stalls or reverses.

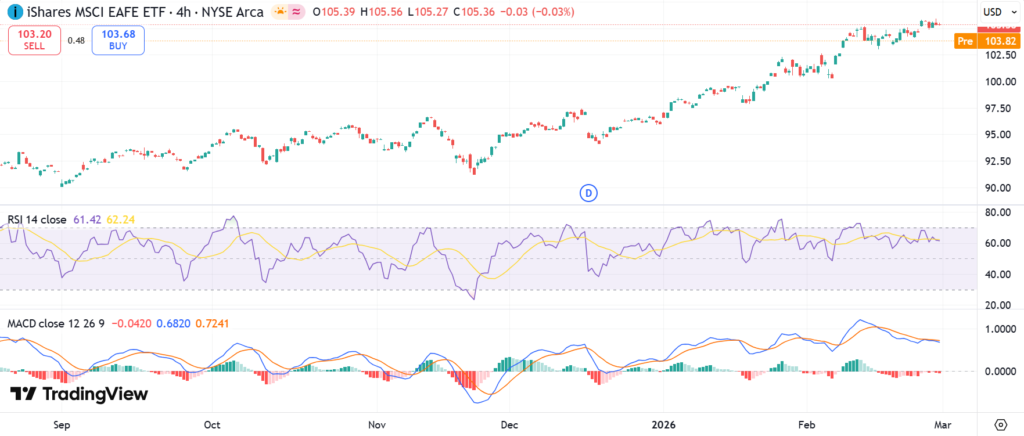
RSI at 69.17 indicates neutral momentum, not overbought yet (above 70 signals caution). MACD at 1.5 gives a buy signal, hinting at building bullish trend. RSI measures speed of price changes; MACD spots shifts in strength.
The 50-day moving average stands at $99.04, with 200-day at $93.82—EFA trades above both, no death cross. Volume trends up lately, averaging over 20 million shares recently versus 15 million yearly. Higher volume confirms real demand behind moves.
This chart shows EFA ETF’s recent price action with key levels marked.
Analyst Ratings & Price Targets
Holdings in EFA ETF earn a moderate buy aggregate rating from 29 analysts. No direct ETF targets, but underlying stocks average upside potential. Recent views stay neutral to positive on developed markets.
Wall Street firms like those covering top holdings see hold as common. No major upgrades noted lately. Sentiment suggests steady growth, helping investors gauge portfolio fit.
Insider Activity
ETFs like EFA have no corporate insiders. Focus shifts to institutional flows: $1.99 billion inflows over the past year. This shows big investors adding shares, implying confidence in EFA ETF forecast.
No selling trends appear. Positive flows signal caution-free positioning amid global recovery.
Valuation Analysis
EFA ETF’s portfolio P/E ratio is 16.57, reasonable for developed equities. Trailing metrics align with blend style; forward growth expected from holdings like ASML. Price-to-sales stays moderate.

Revenue growth in holdings averages solid YoY, with EPS improving. Free cash flow strong across top names; low debt in key firms like Novartis. Compared to US tech like Microsoft, EFA appears fairly valued, not overpriced.
Recent Earnings & Catalysts
ETFs report no quarterly earnings, but holdings drove gains. Top performers like ASML reported strong results, beating revenue expectations. Dividend yield around 2.8% from semi-annual payouts.
Catalysts include AI demand boosting ASML and pharma recovery for AstraZeneca. These lifted EFA ETF performance year-to-date. Strategic Europe focus aids amid US slowdown fears.
Bullish Case
EFA ETF benefits from Europe rebound and Japan reforms. Holdings like SAP show tech demand. Market expansion in developed regions supports revenue growth.
Operational edges in top firms like Novartis ensure steady EPS. Diversification beats US-only risks.
Bearish Case
Competition from US giants pressures margins. Slowing China ties hurt some holdings. Margin squeezes possible with inflation. Regulatory shifts in EU add caution.
Economic slowdowns could spark churn in cyclicals.
Market Sentiment & Investor Psychology
Short interest data limited for ETFs, but fund flows positive at $1.99B yearly. Institutional ownership high, over 70% of shares. Retail piles in on momentum.
Options show balanced calls/puts; sentiment optimistic on global rebound. Momentum bias favors EFA ETF.
Short-Term Outlook
Technicals point to upside if resistance breaks at $106. Volume uptrends support gains. Momentum holds neutral-positive. Watch support at $103 for pullbacks. Realistic range-bound action likely.
Medium to Long-Term Outlook
EFA ETF’s model offers broad developed exposure. Industry growth in tech/pharma aids. Competitive moats in holdings like Roche strong. Financial health solid with low beta at 0.83.
Hold or accumulate for long-term diversification; risks from geopolitics balanced by yields.
FAQ Section
Is EFA ETF a buy right now?
Moderate buy on holdings; suitable for diversification if risk-tolerant.
What is the EFA ETF price target?
No consensus ETF target; holdings imply upside to $106+ short-term.
What are major risks for EFA ETF?
Currency fluctuations, Europe slowdowns, US strength diversion.
EFA ETF forecast for 2026?
Continued growth if global recovery holds; YTD 9% sets positive tone.
Suggestions
Compare with SOXS ETF for broader ex-US exposure
See our Vanguard international ETF forecast
Read our developed markets valuation breakdown
Conclusion
Hold for current investors; watch for entry on dips. EFA ETF offers solid diversification with bullish trends, but global risks warrant caution. Balanced view favors steady allocation over aggressive buys.
Disclaimer: This article is for informational purposes only and not financial advice.