
Explore SOXS ETF price, technical analysis, forecast, and if SOXS ETF is a buy. Detailed review of this 3x inverse semiconductor ETF using latest data.
Introduction
SOXS ETF seeks daily 3x inverse performance of the NYSE Semiconductor Index. It bets against top U.S. semiconductor firms like Nvidia and AMD.
Investors eye SOXS ETF now amid AI chip boom pressuring bearish plays. Strong semi demand drives the underlying index up sharply.
Broader tech rally and rate cuts boost semis, hurting SOXS ETF price. Everyday investors use it for short-term hedges.
Latest SOXS ETF Price & Trend
SOXS ETF closed at $1.79 after hours on February 27, 2026, up 4.07% from $1.72. Volume hit 724 million shares, above average 466 million.


Year-to-date, SOXS ETF lost over 92% as semis soared. The 52-week range spans $1.57 low to $53.43 high.
One-month trend shows -36% drop; three-month -52%; six-month even steeper amid bull run. Overall trend is strongly bearish for SOXS ETF.
This signals tough times for inverse bets as semis thrive. Investors see rebound chances only on sector pullbacks.
Technical Analysis
Support levels sit near $1.57, the year low, where buyers may step in. Resistance looms at $2.00 from recent bounces. These show price floors and ceilings.

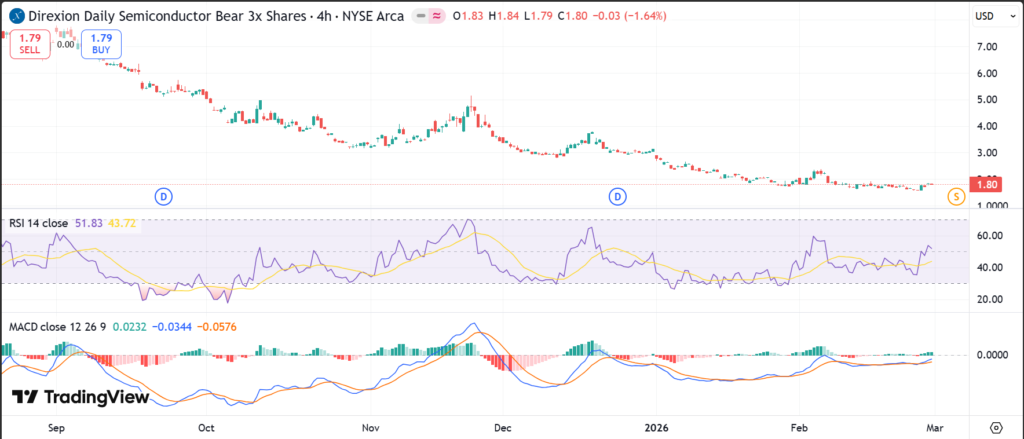
RSI reading hovers low, near oversold territory below 30, hinting at potential bounce. Oversold means selling may ease soon.
MACD trend stays bearish with lines below zero, signaling downward momentum. It compares short and long averages for trend strength.
The 50-day moving average exceeds the 200-day due to decay, no golden cross (bullish MA crossover). Moving averages smooth price to spot trends.
Trading volume trends high at 724 million shares, showing strong interest in this volatile ETF. High volume confirms moves.
Analyst Ratings & Price Targets
Leveraged ETFs like SOXS lack traditional Buy/Hold/Sell ratings from analysts. Focus stays on daily targets, not long-term.
No average price targets exist; Wall Street views it as tactical tool, not investment. Recent notes warn of decay in trends.
This means neutral sentiment. Investors use analyst semi views inversely for SOXS ETF.
Insider Activity
Direxion ETFs like SOXS have no corporate insiders. No buying or selling data applies.
Management activity ties to fund flows, up 1.76 billion USD yearly, showing trader interest. This implies tactical use, not confidence signal.
Valuation Analysis
SOXS ETF, as leveraged inverse, skips P/E or sales ratios. It tracks -3x index daily via swaps and futures. Expense ratio is 0.97-1.02%.


No revenue, EPS, or cash metrics; AUM at 1.12 billion USD. Yield around 18% from distributions, but principal erodes.
Compared to bull semis like SOXX, SOXS suits hedges, not value plays. It appears “fair” for its high-risk role.
Recent Earnings & Catalysts
SOXS reports no earnings; performance mirrors -3x semi index daily. No revenue or EPS beats.
Catalysts include semi downturns from trade wars or overvaluation. AI hype crushed SOXS lately. Guidance: daily reset only.
Index strength post-earnings from Nvidia etc. hammered SOXS ETF performance.
Bullish Case
SOXS ETF rises on semi slumps, like recession hits chip demand. Overbought semis could correct.
High short volume aids if bulls pause. Operational leverage amplifies downside 3x.
Market rotation from tech favors bears short-term.
Bearish Case
Prolonged semi boom from AI erodes SOXS via compounding decay. Up 92% YTD index loss for SOXS.
Competition low, but volatility scares holders. Margin from fees; no churn issue. Economic strength aids semis.
Regulatory chip curbs could help, but unlikely now.
Market Sentiment & Investor Psychology
Short interest unavailable for ETFs; high volume shows trader bets. Institutional ownership at 64 holders, Jane Street tops.
Options activity heavy on this volatile name. Retail chases momentum, hurting long holds.
Sentiment neutral to fearful for holders, optimistic for semis. Value bias absent in tactical play.
Short-Term Outlook
Oversold RSI and high volume suggest bounce possible. Watch semi momentum for pullbacks.
Bearish MACD persists unless index dips. Expect volatility, no clear direction.
Medium to Long-Term Outlook
Daily reset unfit for long holds; decay kills returns in trends. Semi growth strong on AI.
Watch for hedges; avoid accumulation. Hold only if expecting crash.
FAQ Section
Is SOXS ETF a buy right now?
No strong buy case; suits short hedges amid bull semi run. High risk of further decay.
What is the SOXS ETF price target?
No consensus targets; focus daily index inverse.
SOXS ETF forecast?
Bearish in semi bull; potential pop on corrections.
What are major risks for SOXS ETF?
Compounding loss, volatility, trend persistence.
SOXS technical analysis key points?
Oversold RSI, bearish MACD, high volume.
Suggestions
Compare with SOXL ETF
See our semiconductor sector forecast
Read our leveraged ETF risks breakdown
Conclusion
Watchlist SOXS ETF. Ideal for tactical shorts on semis, but decay risks long holds. Use sparingly.
Disclaimer: This article is for informational purposes only and not financial advice.