

BITO Technical Analysis: Trend, Levels & Outlook March 2026
ProShares Bitcoin Strategy ETF (BITO) is one of the first exchange-traded funds designed to provide exposure to Bitcoin through futures contracts rather than holding the cryptocurrency directly. As a crypto-linked ETF listed on U.S. exchanges, BITO allows traditional market participants to gain exposure to Bitcoin price movements without needing to manage digital wallets or interact directly with cryptocurrency exchanges. Because of this structure, the ETF sits at the intersection of the cryptocurrency sector and traditional financial markets.
In March 2026, BITO continues to attract strong attention from retail traders and institutional investors as Bitcoin volatility remains a major driver of market sentiment. The ETF often mirrors the broader direction of the crypto market, though futures-based structures can sometimes produce slight differences in price movement compared with spot Bitcoin. This article explores BITO’s technical structure for March 2026, focusing on price trend behavior, major support and resistance levels, and technical indicators such as RSI, MACD, and trading volume.

Current Price Trend in March 2026
BITO’s price trend during March 2026 reflects the broader volatility seen in the cryptocurrency market. The ETF has experienced several upward impulses followed by short consolidation phases, forming a structure that technical traders often describe as a trend punctuated by corrective pullbacks.
Recent price action suggests that BITO has been moving around its short-term moving averages, particularly the 20-day moving average. This average often acts as a dynamic reference point for momentum traders. When price trades above the 20-day moving average, short-term sentiment is generally considered bullish, while sustained trading below it can indicate temporary weakness.
The 50-day moving average represents a medium-term trend indicator. In the current structure, BITO has tested this level during pullbacks but has generally attempted to maintain price stability above it. Holding above this average could signal that the medium-term bullish structure remains intact despite market fluctuations.
The 200-day moving average remains an important long-term support reference. For many traders, this level defines whether the asset is in a broader uptrend or downtrend. If BITO continues to trade above the 200-day average, it suggests that the overall trend since late 2025 remains constructive, although short-term volatility may continue.
Key Support and Resistance Levels
Support and resistance levels play a central role in technical analysis, particularly for assets like BITO that are influenced by external markets such as Bitcoin.
One key support level appears near recent consolidation lows where price previously stabilized after a downward move. This area represents a zone where buyers stepped in to defend the price, suggesting that traders may monitor it again if the ETF experiences another correction.

Another support level can be observed around the region of the 50-day moving average. Moving averages often act as dynamic support levels, especially during trending markets.
A deeper support zone exists near the 200-day moving average. If price were to decline toward this level, it could signal a broader cooling phase in the crypto market.
On the resistance side, the first key level sits near recent swing highs reached during the latest rally phase. These highs mark an area where selling pressure previously interrupted upward momentum.
The next resistance zone lies slightly above that region, near a previous breakout attempt that failed to hold. If BITO manages to break above this area with strong momentum, it could suggest that bullish sentiment is strengthening again.
A stronger resistance level exists near the ETF’s recent multi-month highs. A break above that level could potentially attract momentum traders watching for continuation patterns.
Indicators – RSI, MACD, Volume
Technical indicators provide additional insight into market momentum and sentiment.
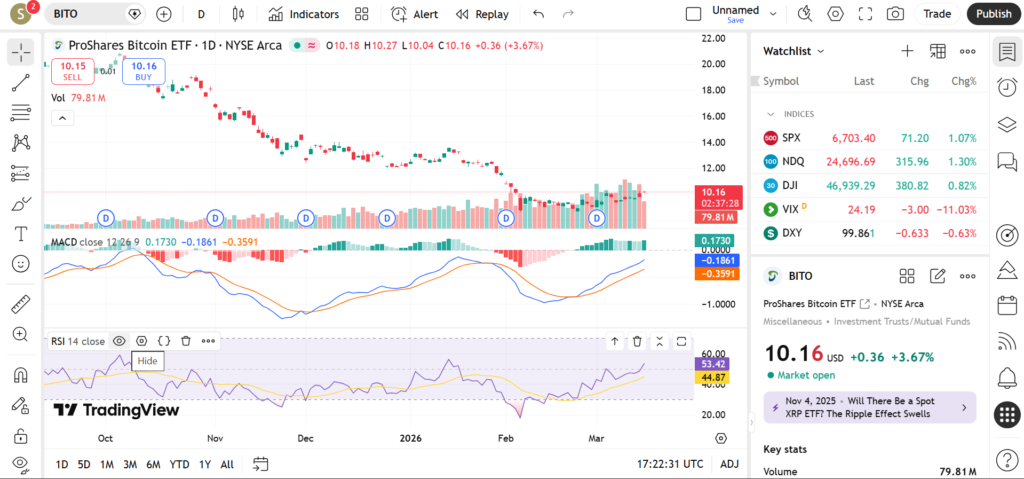
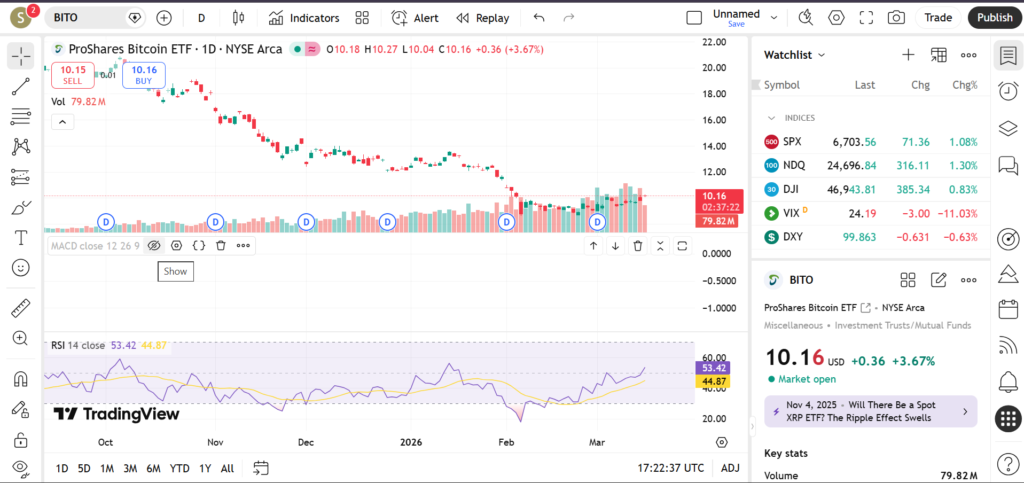
The Relative Strength Index (RSI) for BITO currently fluctuates within the neutral range. This suggests that the ETF is neither strongly overbought nor oversold. Neutral RSI conditions often indicate that the market is consolidating before its next directional move.

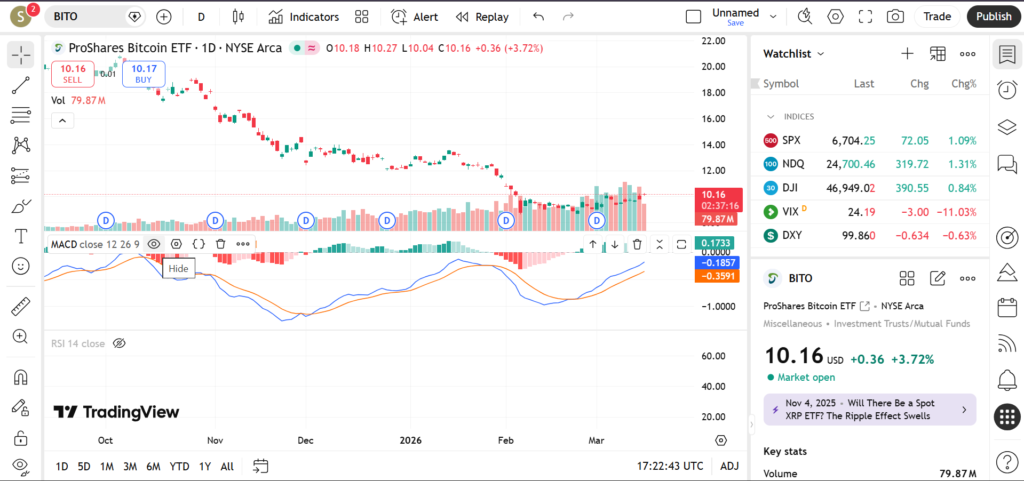
MACD signals have shown alternating bullish and bearish momentum shifts during March. At times the MACD line has crossed above the signal line, suggesting temporary upward momentum. However, the histogram has occasionally flattened, indicating that momentum may be slowing during consolidation phases.
Volume activity in BITO tends to increase during periods of strong Bitcoin price movement. Recent trading sessions have shown noticeable spikes in volume during rallies, which may indicate growing participation from traders seeking crypto exposure through traditional markets.
Short-Term Outlook for BITO in March 2026
BITO’s short-term outlook in March 2026 largely depends on the broader direction of Bitcoin and the cryptocurrency market. If Bitcoin continues to trend higher, the ETF could experience renewed upward momentum as traders seek exposure through regulated financial products.
However, if the crypto market enters a consolidation or correction phase, BITO may remain range-bound between key support and resistance levels.
What traders are watching:
• Bitcoin price momentum influencing ETF sentiment
• Breakout attempts above recent swing highs
• Reactions near the 50-day moving average
• Volume spikes during crypto rallies
• Macro factors affecting risk assets
Risks and Important Notes
Technical analysis is not guaranteed to predict future price movements. External factors such as regulatory news, macroeconomic developments, or sudden shifts in cryptocurrency sentiment can cause technical levels to fail unexpectedly.
Because BITO tracks Bitcoin futures contracts, it may also experience differences compared with spot Bitcoin performance due to futures market dynamics.
This article is intended for educational purposes only and does not represent personalized financial advice.
Traders interested in crypto-related market trends may also explore technical analysis for other cryptocurrency ETFs and blockchain-related stocks to gain a broader perspective on the sector.