

TQQQ Technical Analysis: Trend, Levels & Outlook March 2026
ProShares UltraPro QQQ (TQQQ) is a leveraged exchange-traded fund designed to deliver three times the daily performance of the Nasdaq-100 Index. This ETF provides amplified exposure to large-cap technology and growth companies, making it a popular instrument among active traders seeking high-momentum opportunities. Because the Nasdaq-100 contains many of the world’s largest technology firms, TQQQ often moves strongly during periods of growth-sector volatility.
In March 2026, traders continue to monitor TQQQ closely as technology stocks react to economic data, interest-rate expectations, and corporate earnings updates. Leveraged ETFs like TQQQ can experience significant swings due to their daily reset structure, meaning both rallies and corrections may be amplified compared with the underlying index. This article reviews TQQQ’s current price trend, major support and resistance levels, and signals from commonly used technical indicators including RSI, MACD, and volume.

Current Price Trend in March 2026
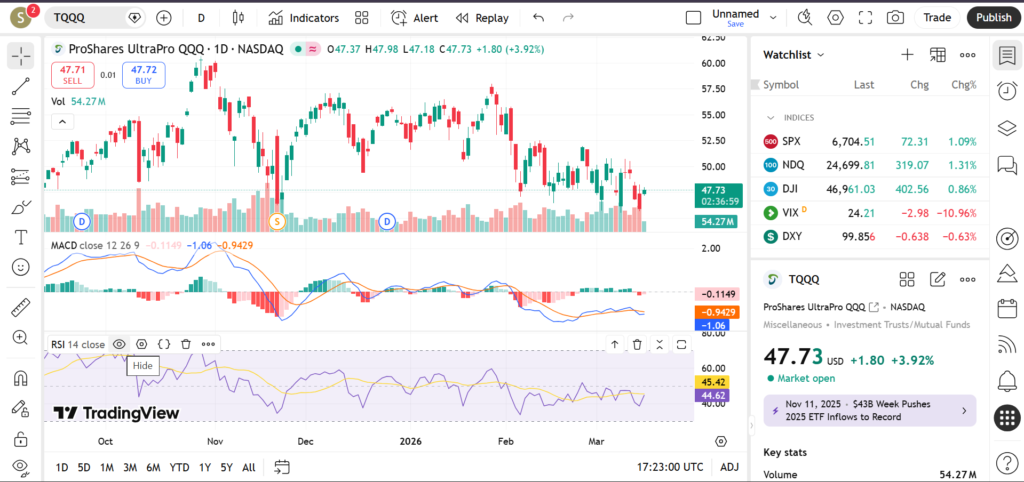
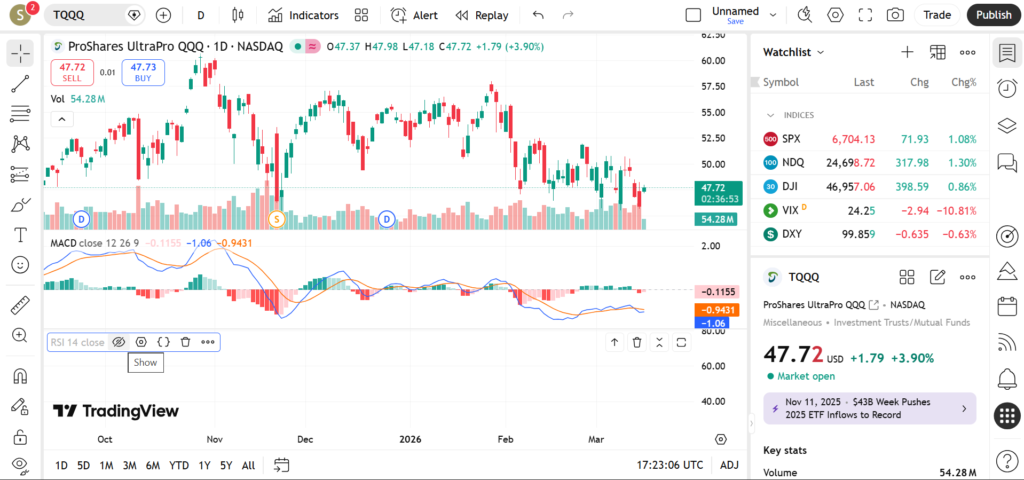
TQQQ has displayed an active trading pattern in March 2026, reflecting the broader movement of the Nasdaq-100 technology sector. The ETF has experienced alternating periods of upward momentum and corrective pullbacks as traders react to changing macroeconomic expectations.
Recent price action suggests that TQQQ has been interacting closely with its short-term moving averages. The 20-day moving average has acted as a dynamic level during short-term rallies and pullbacks. When price remains above this level, traders often interpret it as a sign that bullish momentum is still active.
The 50-day moving average currently represents a key medium-term trend reference. During previous market cycles, pullbacks toward the 50-day average often produced temporary stabilization before the next directional move.
The 200-day moving average continues to serve as a major long-term support level. Many traders consider this average to be an important indicator of the broader market trend. Maintaining price above the 200-day average could suggest that the long-term structure remains constructive even if short-term volatility persists.
Key Support and Resistance Levels
Support and resistance zones are particularly important for leveraged ETFs like TQQQ because price movements can accelerate rapidly once these levels are broken.
One important support level appears near recent swing lows where price previously rebounded after a short correction. This area represents a zone where buyers have historically shown interest.
Another support zone can be observed around the 50-day moving average. This level often acts as a medium-term support line during trending markets.

A deeper support region lies near the 200-day moving average, which represents the long-term structural trend level for the ETF.
On the resistance side, the first key level appears near recent swing highs formed during the latest rally attempt. This area has acted as a barrier where sellers previously took profits.
The next resistance zone lies slightly above that region near previous breakout attempts. If TQQQ manages to break above this level with strong volume, it could signal renewed bullish momentum.
A higher resistance level sits near the ETF’s recent multi-month highs. A successful breakout above that area could attract additional momentum traders.
Indicators – RSI, MACD, Volume
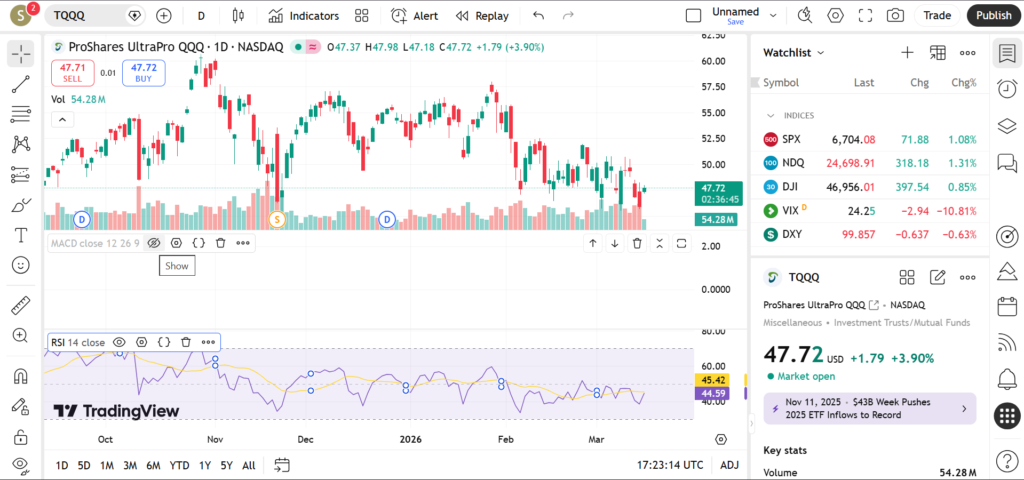
The Relative Strength Index (RSI) for TQQQ currently sits in a neutral range, suggesting that the ETF is not strongly overbought or oversold. Neutral RSI readings often occur during consolidation periods before a stronger directional move develops.
MACD signals during March have alternated between bullish and bearish crossovers, reflecting the ongoing volatility in technology stocks. Traders often watch for sustained histogram expansion to confirm stronger trend momentum.
Volume patterns show that trading activity tends to increase during strong rallies in technology stocks. Rising volume during upward moves can suggest increasing participation from momentum traders.
Short-Term Outlook for TQQQ in March 2026
The short-term technical outlook for TQQQ remains closely tied to the broader performance of the Nasdaq-100 and the technology sector. If tech stocks continue to show resilience, TQQQ could attempt to retest previous highs.
However, rising interest-rate concerns or macroeconomic uncertainty could lead to additional consolidation.
What traders are watching:
• Nasdaq-100 momentum and technology sector strength
• Breakout attempts above recent swing highs
• Reactions near the 50-day moving average
• Volume expansion during rallies
• Economic data influencing growth stocks
Risks and Important Notes
Leveraged ETFs such as TQQQ carry additional risks compared with standard ETFs due to their daily rebalancing structure. While they can amplify gains during strong trends, they can also magnify losses during volatile markets.
Unexpected news events, macroeconomic changes, or sharp movements in technology stocks can cause technical levels to fail.
This article is provided for educational purposes only and should not be interpreted as personalized financial advice.
For further market insights, readers may explore technical analysis of other technology ETFs or leveraged funds that track major U.S. indices.