
MSTX Technical Analysis: Trend, Levels & Outlook March 2026
Defiance Daily Target 2X Long MSTR ETF (MSTX) is a leveraged exchange-traded fund designed to provide amplified exposure to the performance of MicroStrategy-related price movements. Because MicroStrategy is strongly connected to the cryptocurrency market through its large Bitcoin holdings, MSTX often behaves similarly to both technology stocks and crypto-related assets. This makes the ETF particularly attractive to traders looking for high-volatility opportunities.
In March 2026, MSTX has become one of the most closely watched leveraged ETFs as crypto markets continue to influence related equities and funds. Rapid price swings in Bitcoin and crypto-linked companies frequently translate into sharp moves in MSTX. This article examines the ETF’s current technical trend, key support and resistance zones, and signals from RSI, MACD, and trading volume.

Current Price Trend in March 2026
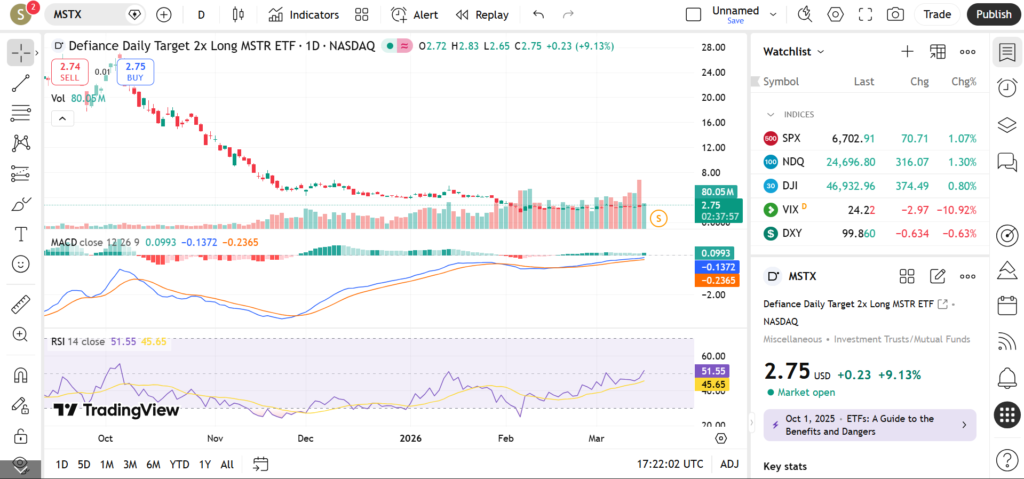
MSTX has been trading in a highly volatile pattern during March 2026, reflecting fluctuations in cryptocurrency sentiment. The ETF’s price action has shown sharp rallies followed by quick pullbacks, creating a wide trading range that technical traders often monitor for breakout opportunities.
The 20-day moving average has been acting as a short-term trend guide. When MSTX trades above this level, momentum tends to favor bullish traders. However, repeated tests of this average suggest the market is still searching for a stable direction.
The 50-day moving average currently sits slightly below recent trading levels, serving as a medium-term support zone. In leveraged ETFs, holding above the 50-day average can sometimes indicate that bullish sentiment remains intact despite short-term volatility.
The 200-day moving average continues to represent the long-term trend baseline. If the ETF remains above this level, it suggests that the broader structure may still favor higher prices over time, although leveraged ETFs rarely move smoothly due to their amplified exposure.
Key Support and Resistance Levels
Support and resistance levels are critical for MSTX because leveraged products tend to accelerate quickly once price breaks through key zones.
One important support level lies near recent consolidation lows formed during pullbacks earlier in March. This area is where buyers previously stepped in after sharp declines, making it a logical level traders may monitor for potential stabilization.
Another support level aligns with the 50-day moving average. Moving averages often act as dynamic support zones, particularly during trending markets.

A deeper support region sits near the 200-day moving average. If price falls toward this level, it could signal broader weakness in the crypto-linked equity space.
Resistance levels begin near recent swing highs formed during short-term rallies. These highs represent zones where selling pressure previously emerged.
The next resistance level appears near previous breakout attempts where price briefly pushed higher but quickly reversed. If MSTX breaks above this level with strong volume, it could indicate renewed bullish momentum.
A higher resistance level exists near the ETF’s recent multi-week highs. Breaking above that region could attract momentum traders looking for continuation moves.
Indicators – RSI, MACD, Volume
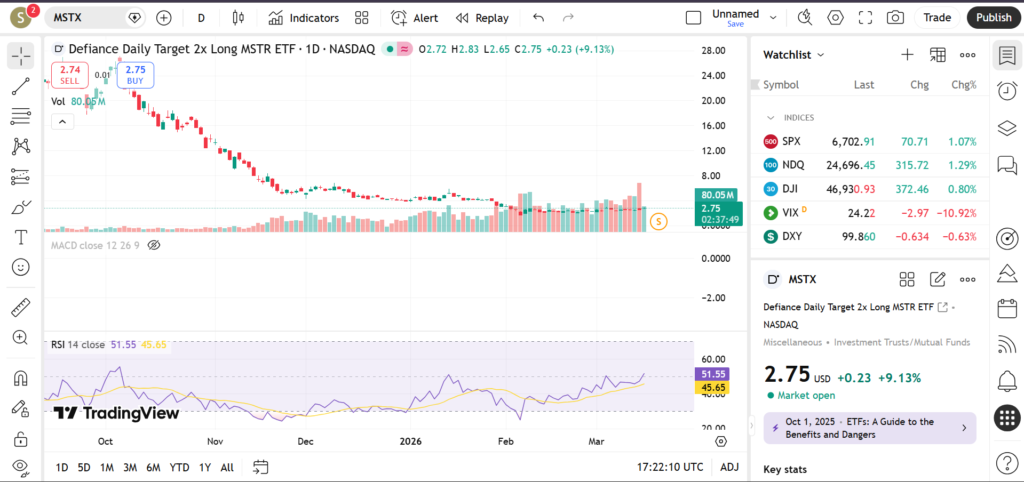
RSI readings for MSTX are currently hovering in the middle range, suggesting the ETF is neither extremely overbought nor oversold. This neutral reading typically indicates that price could move in either direction depending on upcoming catalysts.
MACD signals have recently shown alternating bullish and bearish crossovers, reflecting the rapid shifts in momentum often seen in crypto-linked assets. Traders frequently watch for sustained histogram expansion to confirm stronger trends.

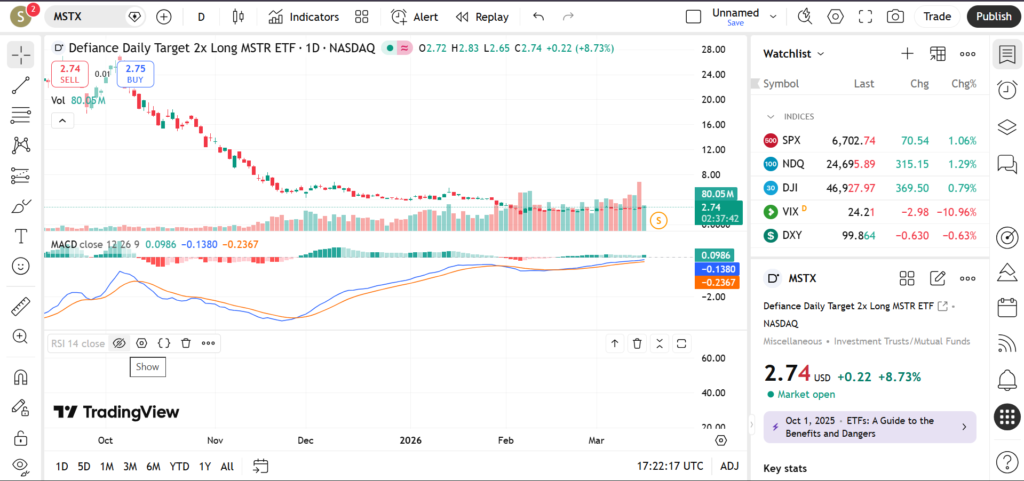
Volume patterns show that trading activity tends to increase during sharp rallies, which may indicate speculative participation. However, occasional volume spikes during pullbacks suggest that volatility remains high.
Short-Term Outlook for MSTX in March 2026
MSTX’s short-term outlook in March 2026 remains closely tied to cryptocurrency market sentiment. If Bitcoin and related assets maintain upward momentum, MSTX could experience strong rallies due to its leveraged exposure.
However, continued volatility may also produce sharp corrections. Traders often focus on support and resistance zones to identify potential breakout or breakdown scenarios.
What traders are watching:
• Bitcoin price momentum influencing crypto-linked equities
• Breakout attempts above recent swing highs
• Reaction near the 50-day moving average
• RSI momentum shifts
• Volume spikes during crypto market rallies
Risks and Important Notes
Leveraged ETFs like MSTX carry additional risks due to daily rebalancing and amplified volatility. Sudden moves in cryptocurrency markets or macroeconomic developments can lead to rapid price swings.
Technical levels should always be interpreted as potential zones rather than guaranteed turning points.
This analysis is for educational purposes only and should not be considered personalized financial advice.
For more insights, traders may explore analysis of other crypto-related ETFs or technology sector funds to compare technical trends.