
XLE technical analysis March 2026 outlook
The Energy Select Sector SPDR ETF (XLE) tracks the Energy Select Sector Index, giving traders liquid, diversified exposure to large U.S. energy names such as Exxon Mobil, Chevron, and ConocoPhillips within the S&P 500 energy sector. As one of the largest and most actively traded sector ETFs, it is a popular vehicle for expressing views on oil prices, energy equities, and macro themes like inflation and geopolitical risk.
In early March 2026, XLE is trading in the mid‑50s after a steady rebound off its late‑February lows, with price currently hovering modestly above recent support and below prior short‑term highs. This article looks at the current price trend, key support and resistance zones, and what core indicators such as the 20/50/200‑day moving averages, RSI, MACD, and volume are suggesting for traders monitoring XLE in March 2026.
Current Price Trend in March 2026
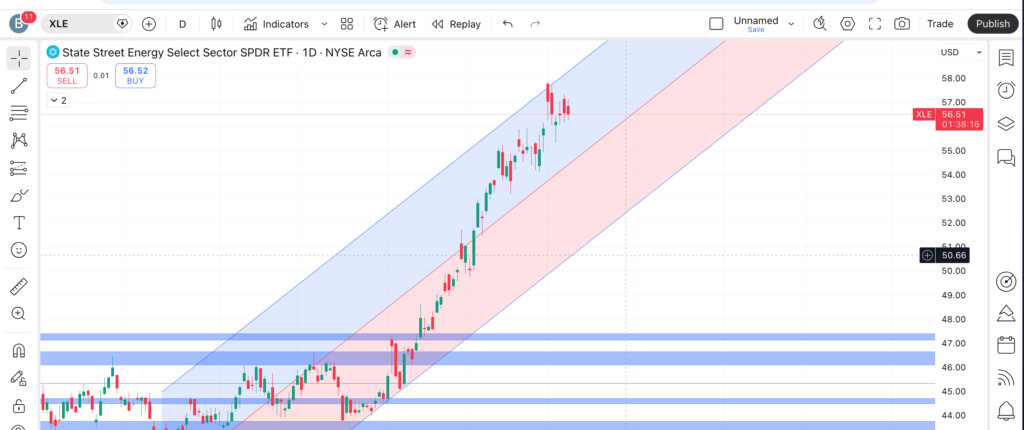
XLE is currently in a short‑term uptrend following a late‑February pullback that held above its prior swing low from earlier in the year. Prices have bounced from the low‑ to mid‑50s area, with recent trading around the mid‑50s and a pattern of higher lows on the daily chart into early March. This positioning suggests buyers have stepped in on dips, even as the ETF remains below its 52‑week highs from late 2025.
From a moving‑average perspective, XLE is trading above its 20‑day moving average, which has turned higher after flattening during the February consolidation. The 50‑day moving average sits below the current price but still noticeably above the 200‑day, reflecting a broader intermediate uptrend from 2025 into early 2026. With the 200‑day moving average well below the current market, the longer‑term trend remains constructive, while short‑term swings in March are driven more by energy prices and risk sentiment than by structural trend changes.
For retail traders, this combination—price above 20‑ and 50‑day averages, and the 50‑day above the 200‑day—often indicates a bullish bias on pullbacks, while still allowing for choppy, headline‑driven sessions typical of the energy sector. However, failure to hold recent higher lows would signal that this short‑term uptrend is losing momentum and that a broader range or deeper correction could be developing.
Key Support and Resistance Levels
Support levels
- Recent swing‑low support in the low‑ to mid‑50s
The late‑February lows in the low‑50s created a visible pivot where buyers stepped in aggressively, and price subsequently pushed back toward the mid‑50s by early March. A return to this zone and a strong reaction higher could reinforce it as a key demand area in March. - Short‑term moving‑average support around the rising 20‑day
The 20‑day moving average is now tracking just below current price, acting as dynamic support during this rebound phase. Short‑term traders often look for intraday bounces near a rising 20‑day in an uptrend as evidence that momentum buyers remain active. - Deeper support near the 50‑day moving average
The 50‑day moving average lies further below, marking a more medium‑term line in the sand where dip buyers have historically appeared over the last several months. A clean break below the 50‑day would warn that the recent up leg is stalling and that a broader consolidation or correction could unfold.
A decisive move below the February swing‑low area would suggest that the pattern of higher lows has failed, potentially opening the door to a test of the 200‑day moving average and an extended period of range‑bound or bearish behaviour.

Resistance levels
- Near‑term resistance around recent early‑March highs
XLE is encountering resistance near its early‑March swing high, which sits only modestly above the current mid‑50s price region. Sellers responded there previously, creating a short‑term ceiling that traders are watching as a key breakout point for March. - Prior late‑2025 / early‑2026 peak zone closer to the 52‑week high
Above the recent swing highs, a broader resistance band aligns with prior peaks from late 2025 where XLE stalled after a strong rally. This area is psychologically important because it represents the zone where profit‑taking previously overwhelmed buying interest. - Longer‑term resistance at round‑number levels
Round numbers above the current market (for example, levels slightly above the recent range) often act as magnets and potential congestion zones as traders place stop orders and take‑profit targets around them. A strong move through such a round‑number barrier with elevated volume can indicate fresh institutional participation.
If XLE breaks and holds above the early‑March swing‑high resistance, it could signal that bulls are regaining control and may attempt another run at the prior 52‑week high region. Conversely, repeated failures at this resistance band could keep the ETF locked in a sideways range through much of March, favouring short‑term mean‑reversion strategies over breakout setups.
Indicators – RSI, MACD, Volume
On the daily chart, the Relative Strength Index (RSI) is sitting in a neutral to mildly bullish zone—above oversold conditions, but not yet stretched into classic overbought territory. This positioning is consistent with a recovery off lows that still leaves room for additional upside before momentum appears overheated. Traders often view a rising RSI from the mid‑40s to 60s as constructive as long as price continues to hold above key moving averages.

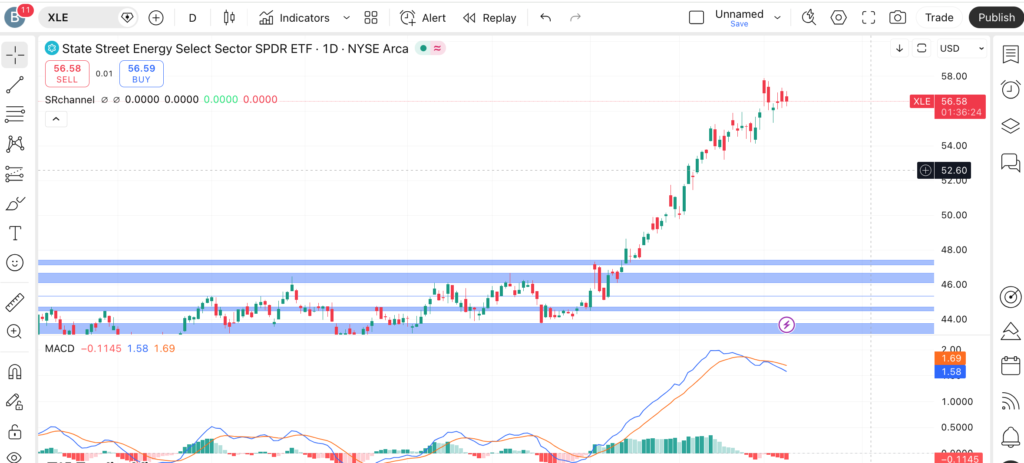
The MACD has recently shown signs of a bullish crossover as the short‑term moving average component turns higher above the longer‑term component, reflecting improving upside momentum after the February dip. The MACD histogram has ticked positive or less negative, suggesting that downside momentum has faded and that bulls are slowly gaining traction. However, the signal is not extreme, so traders may still treat it as early‑stage momentum rather than a fully confirmed, powerful trend leg.
Volume in XLE remains robust compared with many other sector ETFs, thanks to its role as a primary energy proxy, but recent days have seen moderate rather than explosive volume spikes. Turnover picked up during the late‑February pullback and subsequent rebound, hinting at active dip‑buying and repositioning as energy prices stabilized. Rallies on slightly higher volume than on pullbacks suggest accumulation, but traders will want to see any breakout above recent resistance accompanied by clearly above‑average volume to add conviction.
Short‑Term Outlook for XLE in March 2026
Overall, the technical picture for XLE in March 2026 leans cautiously bullish in the short term, with price above key moving averages, a pattern of higher lows, and supportive signals from RSI and MACD. As long as the ETF holds above its late‑February support area and the rising 20‑ and 50‑day moving averages, traders may continue to treat dips as potential opportunities within an ongoing intermediate uptrend.
However, energy remains a macro‑sensitive sector, so XLE’s path in March could still be choppy, influenced by oil price swings, OPEC+ headlines, and evolving expectations for interest rates and growth. A failure to break above near‑term resistance or a sudden rise in downside volume would caution that the current bounce is losing steam and that a more extended consolidation phase is likely.
What traders are watching
- Holding of support in the low‑ to mid‑50s region and reactions near the 20‑ and 50‑day moving averages on pullbacks.
- A potential daily close above the early‑March swing‑high resistance band as a sign that bulls are attempting a fresh leg toward prior 52‑week highs.
- RSI behaviour around the 60–70 area to see whether momentum becomes stretched or continues to support a grinding uptrend.
- MACD follow‑through after the recent bullish crossover—whether the histogram expands positively or quickly rolls over again.
- Sector and macro catalysts, including crude oil price trends, OPEC+ decisions, geopolitical developments, and changes in expectations for Fed policy and global growth that often impact energy equities.
Risks and Important Notes
Technical levels and indicator readings, while useful, can fail quickly when unexpected news hits the market, especially in a sector tied closely to commodities and geopolitics like energy. Shocks such as abrupt changes in oil supply or demand, major geopolitical events, unexpected economic data, or central‑bank decisions can cause gaps through both support and resistance levels.
Retail traders should treat chart levels, moving averages, and indicators as tools for structuring scenarios and risk, not as guarantees of future performance. It is important to consider position sizing, diversification, and personal risk tolerance, and to combine technical analysis with an understanding of the broader macro backdrop. Nothing in this article is personalized financial advice; each trader should assess whether XLE fits their own strategy, timeframe, and risk profile.
In the coming weeks, traders interested in XLE may also want to study technical setups in related energy or sector ETFs such as other U.S. energy funds, global energy ETFs, or broader sector products like financials or industrials that tend to move with cyclical themes. Comparing how XLE behaves around its key levels versus peers can provide additional context and help refine trading plans for March 2026 and beyond.