

SCO technical analysis March 2026: key support and breakdown risk
The ProShares UltraShort Bloomberg Crude Oil ETF (SCO) is a leveraged inverse commodity ETF that targets two times the opposite of the daily performance of a WTI crude oil futures index. It belongs to the energy/commodities space and is designed as a short‑term tactical instrument for traders who want to benefit from falling oil prices or hedge long crude exposure, rather than a traditional buy‑and‑hold energy ETF.
In March 2026, SCO is trading near its 52‑week low after a sharp multi‑month decline, as strength in crude oil has pressured this inverse product. Recent sessions show the ETF attempting to stabilize in the low double‑digits after sliding from the mid‑teens area in February, making it a focal point for active traders watching whether crude’s rally pauses and whether SCO can defend current support or continues to grind lower. This article will review the current price trend, key support and resistance zones, and what the RSI, MACD, and volume patterns suggest for SCO in March 2026.
Current Price Trend in March 2026
The short‑term trend in SCO is a clear downtrend, with price making a series of lower highs and lower lows from December 2025 into early March 2026. The ETF has fallen from levels above 20 in late 2025 to around the low‑teens and then toward the 52‑week low area near 10 in early March, mirroring sustained strength in WTI crude oil futures. This persistent weakness reflects the leveraged inverse structure: as oil rises over time, SCO tends to decay, especially when held longer than a few days due to daily compounding effects.
On the moving‑average side, SCO is trading below its 20‑day, 50‑day, and 200‑day simple moving averages, with each of these lines sloping downward. The 20‑day sits just above recent prices and is acting as near‑term dynamic resistance, while the 50‑day is higher still, emphasizing the depth of the recent slide. The 200‑day moving average is far overhead after months of decline, underscoring that the dominant intermediate‑term trend remains bearish, and any short‑term bounces may still be considered counter‑trend within that broader context.
For retail traders, this combination of price below all major moving averages, with the shorter averages also below the longer ones, generally indicates that rallies into these moving‑average areas may be viewed as potential exhaustion points rather than evidence of a fully reversed trend. However, because SCO is leveraged and tied to a volatile commodity, reversals can still be sharp; traders often pay more attention to intraday price structure and crude oil headlines than they would with a standard equity ETF.
Key Support and Resistance Levels
Support levels
- 52‑week low support in the low‑10s
SCO is now testing a critical support band near its 52‑week low around the low‑10s, where recent March sessions show buyers trying to defend against further breakdown. This zone is psychologically important because a decisive breach could signal continued strength in crude oil and invite additional selling or stop‑loss activity. - Recent March bounce level slightly above the low
After a sharp drop in early March, SCO attempted a small intraday rebound from just above the recent low, creating a minor short‑term support shelf within a tight range. If price repeatedly holds this micro‑support on intraday dips, traders may treat it as a reference level for very short‑term mean‑reversion trades. - Deeper support based on prior volume nodes from late 2025
Looking back at historical data, there are prior high‑volume areas from late 2025 in the low‑teens where significant trading previously took place. If SCO were to undercut current lows but quickly snap back above those prior volume nodes, it might indicate a “false breakdown” scenario where sellers become exhausted.
A sustained close below the current 52‑week low region would reinforce the prevailing downtrend and could signal that traders expect continued resilience in crude oil prices, increasing the risk of further decay in SCO. For traders, such a move might indicate that any long positions in SCO carry elevated risk unless crude oil itself shows signs of topping or reversing.

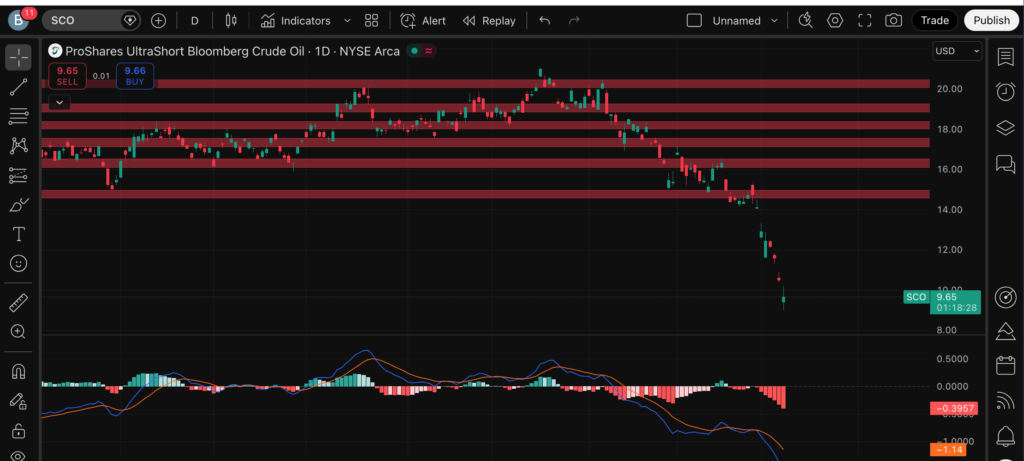
Resistance levels
- Near‑term resistance around the recent March swing‑high rebound
The first resistance zone sits around the recent short‑term bounce high, modestly above current price but still well below the mid‑February levels. This area coincides roughly with the declining 20‑day moving average, making it a logical level where short‑term rallies have stalled and where traders may watch for potential rejection. - Mid‑February consolidation band in the mid‑teens
A more substantial resistance cluster appears in the mid‑teens area, where SCO consolidated in February before breaking sharply lower into March. This band also overlaps with the 50‑day moving average, reinforcing its role as a medium‑term hurdle that would need to be reclaimed for the technical picture to improve meaningfully. - Higher‑timeframe resistance near the 200‑day moving average
Farther overhead, the 200‑day moving average marks a longer‑term resistance level that remains well out of reach under current conditions. If SCO were ever to mount a full trend reversal, traders would expect to see price reclaim and hold above this line, a scenario that would likely require a significant and sustained downturn in WTI crude.
A break above the nearby March rebound high and the 20‑day moving average could signal the start of a short‑covering rally or a tactical counter‑trend move, especially if crude oil shows signs of softening. Conversely, repeated failures near the mid‑teens resistance band would reinforce the bearish structure and suggest that rallies are being used to exit positions rather than initiate new long exposure.
Indicators – RSI, MACD, Volume
On the daily chart, the Relative Strength Index (RSI) for SCO is hovering in a neutral to slightly oversold zone after spending time under the standard 30 level during recent selloffs. This shows that bearish pressure has been intense but may be easing as the ETF consolidates near its 52‑week low. A gradual rise in RSI from oversold toward the 40–50 band could signal that the pace of decline is slowing, even if a full trend reversal is not yet in place.

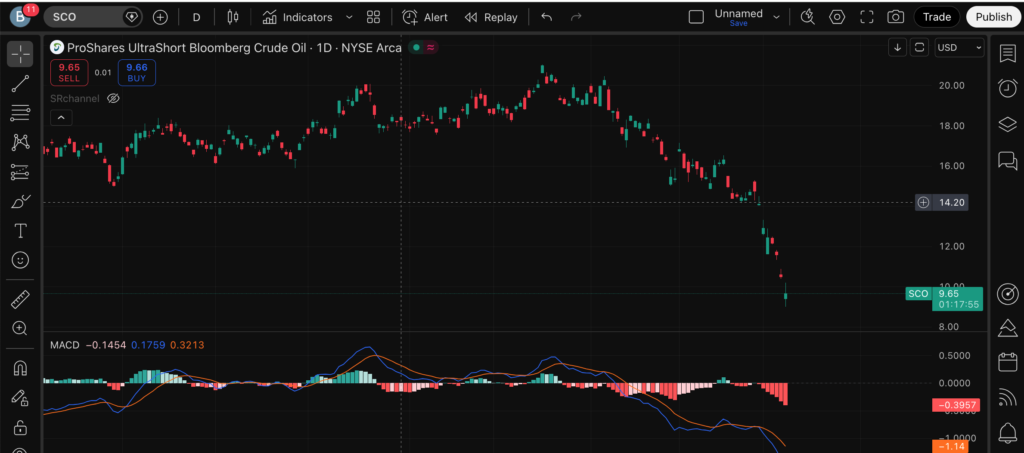
The MACD indicator remains in bearish territory, with the MACD line below the signal line and the histogram recently negative, indicating that downside momentum has dominated the last several weeks. There are some early hints that the histogram’s negative bars are shrinking, which could suggest that selling momentum is fading and that SCO might be entering a basing or sideways phase. Traders may watch for a potential bullish crossover as an early sign of a counter‑trend bounce, while remembering that such signals in leveraged products can be short‑lived.
Volume in SCO is notably elevated compared with typical ETF trading, with March sessions showing tens of millions of shares changing hands on some days as oil volatility has increased. Large volume spikes have tended to accompany sharp down days, suggesting aggressive selling or hedging activity when crude oil rallies strongly. Pullback days in SCO (when price briefly rises) often occur on somewhat lighter volume, which may indicate that these moves are mostly short‑covering rather than large new bullish positions being established.
Short‑Term Outlook for SCO in March 2026
From a technical standpoint, SCO’s short‑term outlook in March 2026 remains cautiously bearish, but with some possibility of oversold bounces if crude oil pauses or pulls back. Price is pinned near 52‑week lows, below all major moving averages, and momentum indicators still lean negative, indicating that sellers retain control overall. At the same time, oversold RSI readings and decelerating downside momentum hint that the steepest part of the decline might be easing, increasing the odds of sharp but potentially short‑lived counter‑trend rallies.
Given SCO’s design as a -2x daily inverse ETF, traders often treat it as an intraday or very short‑term vehicle rather than a long‑duration holding, because compounding and volatility can cause performance to diverge from simple “-2x crude over time” expectations. In March, the key questions for traders are whether crude oil continues its advance, whether SCO can hold its 52‑week low support, and how any bounce behaves as it approaches the 20‑ and 50‑day moving averages.
What traders are watching
- Holding or breaking of SCO’s 52‑week low area in the low‑10s as an important gauge of whether the downtrend is extending or stabilizing.
- Price behaviour around the declining 20‑day and 50‑day moving averages on any rebound, to see if these levels act as resistance.
- RSI movement out of oversold territory and any MACD bullish crossover as potential signs of a short‑term relief rally.
- Day‑to‑day volume spikes, especially on big crude oil moves, to distinguish between panic‑driven selling and more measured position adjustments.
- Macro and sector catalysts such as OPEC+ decisions, geopolitical developments affecting oil supply, U.S. inventory data, and changes in expectations for global growth that influence WTI prices.
Risks and Important Notes
Technical setups in leveraged inverse ETFs like SCO carry additional risk because of their daily rebalancing and compounding characteristics. Even if crude oil eventually turns lower, choppy price action along the way can still erode the value of SCO over time, making it more suitable for short‑term tactical trades than for long‑term directional bets.
In addition, technical levels and indicators can fail quickly when unexpected macro or geopolitical events hit the oil market, leading to gaps through both support and resistance zones. Traders should consider risk management tools such as defined position sizes and clear exit plans, and they should avoid relying solely on charts without understanding the underlying crude oil drivers. Nothing in this article is personal investment advice; each trader should decide whether SCO aligns with their own timeframe, risk tolerance, and trading plan.
In the coming weeks, traders following SCO may also want to monitor related energy and oil‑linked ETFs, such as non‑leveraged crude oil products, other inverse oil funds, and broad energy sector ETFs like XLE, to compare how different structures respond to the same underlying crude moves. Studying correlations, volatility patterns, and technical levels across these instruments can help refine strategies and choose the most appropriate vehicle for a given oil view.