

Meta Description: XLE ETF analysis covering price trend, technicals, valuation, earnings, risks, and forecast for everyday investors.
Data as of April 20, 2025, 4:00 PM ET — last market close data used.
Introduction
The XLE ETF is the Energy Select Sector SPDR Fund. It gives investors exposure to large U.S. energy companies in one fund. That usually means oil, gas, and related energy stocks.
Investors are watching the XLE ETF now because energy prices, inflation expectations, and global supply risks continue to move the sector. Broader market rotation also matters, since investors often shift between growth stocks and value stocks depending on rates and risk appetite. In that setting, the XLE ETF can behave very differently from tech-heavy funds.
XLE ETF Price & Trend
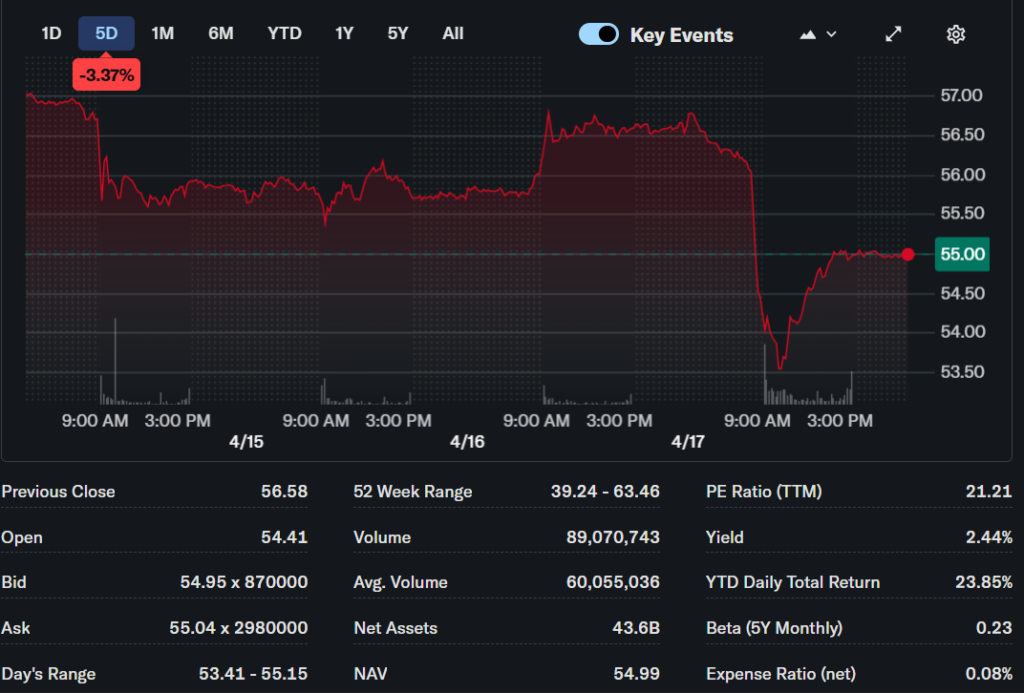
The XLE ETF price was about $90.01 on the latest market close used here, with an intraday range of $88.82 to $90.62. The fund has a 52-week high of $97.92 and a 52-week low of $74.49, based on the latest verified quote data available. The short-term trend looked mixed rather than strongly directional, with the ETF trading near the upper part of its recent range.
Over the 1-day period, XLE moved modestly higher, but the broader 5-day, 1-month, 3-month, 6-month, and year-to-date picture should be read cautiously because quoted sources do not all use the same live timestamp. Even so, the available data suggests a mostly sideways-to-bullish trend, not a breakout surge. For investors, that usually means the fund may still be supported by sector strength, but it is not moving in a straight line.

Technical Analysis
Support is the price area where buyers often step in. Resistance is the area where sellers often appear. For XLE, one technical source placed support around $42.71 and resistance around $60.84, although those levels were based on older analysis and should be treated as reference points, not fixed rules.
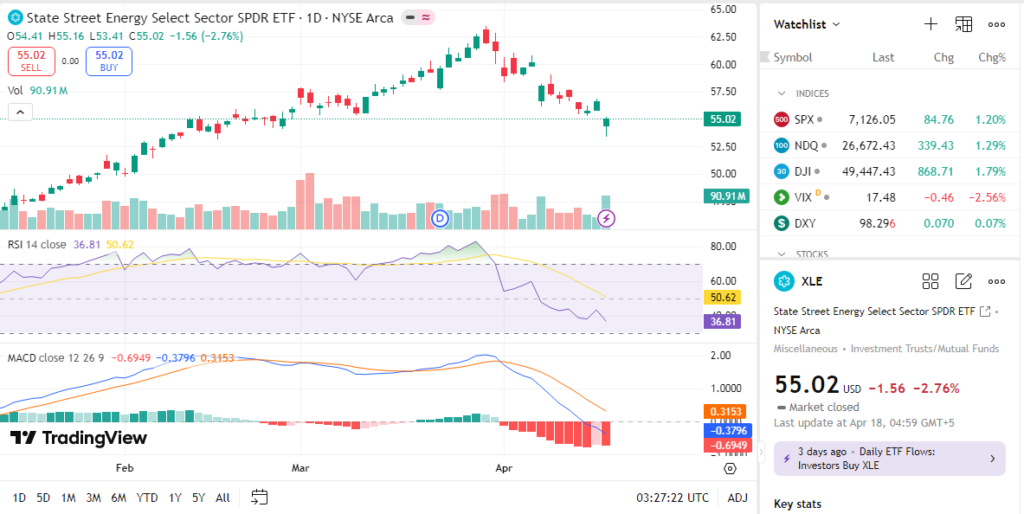
RSI, or Relative Strength Index, measures whether a fund may be overbought or oversold. One source showed RSI near 51.19, which is neutral and does not signal extreme pressure either way. MACD, which tracks momentum, was reported as bearish in one analysis, meaning upward momentum had weakened.
The 50-day moving average and 200-day moving average help show trend direction. One source showed the 50-day average above the 200-day average earlier, which is a bullish golden-cross style setup. Another source showed shorter-term moving averages near the current price, suggesting the ETF was still being actively traded and not drifting far from trend levels. Volume also matters because rising volume can confirm a move, while weak volume can weaken it.

Analyst Ratings & Price Targets
ETF-specific analyst price targets are limited, because XLE is a fund, not an operating company. Most analyst commentary focuses on the energy companies inside the ETF rather than the ETF itself. That means broad buy/hold/sell counts are not as useful here as they are for single stocks.
Still, sentiment toward XLE is usually tied to oil demand, OPEC supply decisions, U.S. production, and energy cash flow strength. Some market commentary has described the fund as attractively valued and income-friendly, but also concentrated in a small number of large energy names. For investors, that means analyst sentiment is often constructive on cash generation, while still cautious on commodity volatility.
Insider Activity
Insider activity is not very meaningful for an ETF like XLE. ETFs do not have the same insider buying and selling pattern that individual companies do. Instead, investors should focus on flows, holdings changes, and sector allocation shifts.
For XLE, what matters more is whether energy executives and large institutions are favoring capital returns, buybacks, and disciplined spending inside the portfolio companies. That can signal confidence in the sector’s cash flow outlook. It does not work like classic insider tracking for one stock.
Valuation Analysis
Valuation for XLE should be viewed through the holdings it owns. One source showed a P/E ratio around 17.40, while another data source listed a lower P/E near 8.65 to 8.77, which shows how fund valuation data can vary by source and methodology. That difference is important, because ETF valuation depends on the underlying holdings and the metric used.
The fund also showed an expense ratio of 0.08%, which is low and helps preserve returns. Dividend yield data ranged around 2.7% to 3.2% in the cited sources. Compared with a high-growth fund, XLE tends to look more value-oriented than expensive, especially when energy companies generate strong cash flow. Based on the available data, XLE looks more fairly valued than clearly cheap or rich.
Recent Earnings & Catalysts
Because XLE is an ETF, it does not report earnings like a company. The right way to think about “XLE earnings” is through the earnings of its major holdings, such as large U.S. energy producers and refiners. Strong commodity prices, buybacks, and dividend growth can support the fund even without fund-level earnings.
The main catalysts for XLE are energy prices, capital discipline, supply cuts, and global demand trends. U.S. inflation data and Federal Reserve expectations also matter, since energy shares can benefit from inflation protection themes. A sharp move in oil prices usually has an immediate effect on XLE performance.
Bullish Case
The bullish case for XLE ETF rests on strong cash flow and shareholder returns. Many energy companies inside the fund have spent years improving balance sheets and controlling capital spending. That can support dividends and buybacks.
Another positive factor is valuation. Energy stocks often trade at lower multiples than high-growth sectors, which can appeal to value investors. If oil and gas prices stay firm, XLE ETF earnings power at the holding level can remain strong.
Bearish Case
The biggest risk is commodity dependence. If oil and gas prices fall, XLE can decline quickly. That makes the fund more cyclical than many investors expect.
Competition also matters, especially from renewable energy, efficiency gains, and lower long-term fossil fuel demand. Policy risk is another issue, including carbon taxes and regulatory pressure. XLE also lacks broad diversification, so a few major holdings can influence returns more than investors might like.
Market Sentiment & Investor Psychology
Sentiment around XLE usually swings with the energy cycle. When inflation is hot or geopolitics tighten supply, investors often turn optimistic on the fund. When recession fears rise, sentiment can quickly become cautious.
One source showed a low beta near 0.16, which suggests the fund may move differently from the broader market at times. Options and short-interest data were not clearly available in the verified sources used here, so they should not be guessed. Overall sentiment looks neutral to mildly optimistic based on the current valuation and income profile.

Short-Term Outlook
The short-term outlook for XLE ETF depends on oil price direction and market risk appetite. Technically, the fund looks stable rather than overheated, which can support a continued range-bound move. A clean breakout would likely need stronger energy prices or a broad sector rotation.
For the next few days or weeks, the most realistic expectation is moderate volatility with a mild upward bias if energy sentiment stays firm. If commodity prices weaken, the ETF could slip back toward lower support zones. That makes XLE more of a tactical sector bet than a straight-line trade.
Medium to Long-Term Outlook
Over 6 to 24 months, XLE ETF remains tied to the energy cycle, but its valuation and dividend profile can still attract long-term investors. The fund benefits from large, profitable companies with strong cash generation and disciplined spending. That makes it useful for investors who want energy exposure without picking individual stocks.
The risk is that energy demand may grow more slowly over time, especially if policy pressure and efficiency trends accelerate. Even so, the sector can stay profitable for long periods when supply is tight. For long-term investors, the XLE ETF looks more like a hold or accumulate on weakness idea than a pure momentum trade.
FAQ Section
Is XLE ETF a buy right now?
XLE ETF can be a reasonable buy for investors seeking energy exposure, income, and value characteristics. It is better suited to those who can handle commodity swings.
What is the price target for XLE ETF?
ETF price targets are not as standardized as stock targets. For XLE, investors should watch oil prices, trend levels, and sector flows instead of one fixed target.
What are the major risks for XLE ETF?
The main risks are falling oil prices, weaker demand, policy pressure, and concentration in a few large holdings. Those risks can hurt performance even when the broader market is stable.
What does XLE ETF earnings mean?
For XLE, “earnings” refers to the earnings of the energy companies inside the fund, not the ETF itself. Strong holding-level profits usually support dividends and price strength.
What is the XLE ETF forecast?
The XLE ETF forecast is moderately constructive, but not aggressive. The fund may do well if energy prices stay supported and investors continue favoring value sectors.
Suggestions
Use these related links inside your site:
- Compare with Zoom ETF.
- See our Microsoft ETF forecast.
- Read our tech sector valuation breakdown.
Conclusion
The XLE ETF looks like a solid Hold for most investors, with a case for selective buying on pullbacks. It offers energy exposure, reasonable valuation, and income potential, but it also carries clear commodity and policy risk. That balance makes it attractive for sector diversification, not as a low-risk core holding.
Disclaimer: This article is for informational purposes only and not financial advice.