

SPDR S&P 500 ETF Trust: Broad Market at Key Juncture
SPY is the State Street SPDR S&P 500 ETF Trust, tracking the S&P 500 index of large-cap U.S. stocks across diverse sectors like technology, finance, and healthcare. Traders are eyeing SPY in March 2026 amid President Trump’s policy shifts, inflation data, and tech sector rotation, with the ETF reflecting steady but cautious broad market gains.
This article delivers actionable technical analysis for SPY in March 2026, examining trends, pivotal support/resistance, indicators, and trader focuses without direct buy/sell signals.

Current Price Trend in March 2026
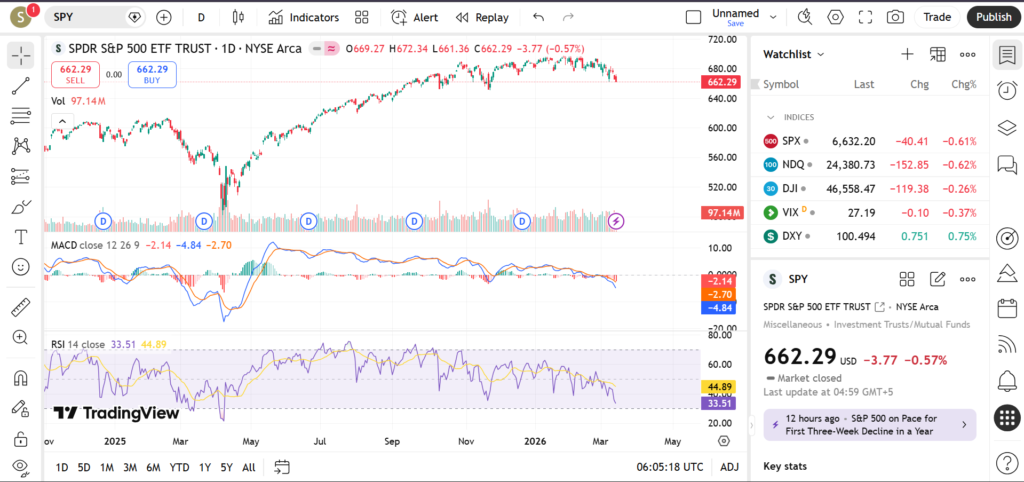
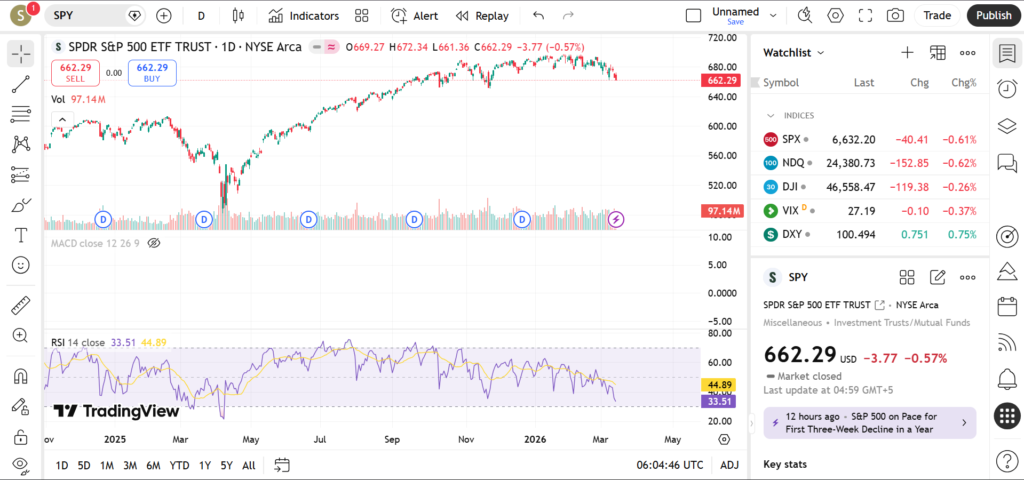
SPY exhibits a mild uptrend in March 2026, with price consolidating near all-time highs after a strong Q1 rally, though showing signs of range-bound action. Recent swings include a push to new peaks followed by minor pullbacks, holding above rising moving averages.
The 20-day and 50-day MAs are aligned bullishly below price, with the 200-day MA providing firm long-term support; no major breakdowns, but flattening momentum suggests potential pause.
Key Support and Resistance Levels
Support Levels:
- SPY 20-day MA (~$580) – Dynamic support from recent uptrend; prior bounces here.
- $570 – Previous monthly low and round number; gap fill potential.
- 50-day MA (~$560) – Confluence with Fibonacci retracement.
- $550 – 200-day MA zone; major long-term support.
Resistance Levels:
- All-time high (~$600) – Psychological barrier; recent tests failing.
- $605 – Projected extension from March swings.
- $610 – Round number and upper Bollinger Band.
- $620 – Multi-month pivot high.
Breaking above $600 resistance could signal renewed upside toward $610, bolstering bull case, while a drop below $580 support might trigger pullback to $570, alerting traders to trend weakness.


Indicators – RSI, MACD, Volume
RSI on SPY is neutral around 55-60 in March 2026, neither overbought nor oversold, allowing room for continuation but watching for divergence. This balanced reading supports range trading until extremes emerge.
MACD displays bullish alignment with line above signal, though histogram contracting indicates fading momentum; potential for crossover if volume supports. Volume remains steady on advances but dips on pullbacks, typical of mature uptrends without panic spikes.

Short-Term Outlook for SPY in March 2026
SPY’s setup leans bullish short-term in March 2026, backed by moving average support and neutral indicators, but overhead resistance tests conviction amid macro noise. Consolidation could resolve higher if catalysts align.
What traders are watching:
- Breakout above $600 on Trump policy news.
- CPI data impacting Fed rate cut odds.
- Tech sector earnings from S&P heavyweights.
- VIX below 15 for risk-on confirmation.
- DXY weakness boosting equities.
Risks and Important Notes
Broad market ETFs like SPY face risks from geopolitical events, election rhetoric, or economic surprises overriding technicals. Volatility can spike unexpectedly, so traders may use stops and monitor fundamentals alongside charts.
This is educational content only; consult professionals for personal strategy.
Explore our analysis on QQQ (Nasdaq ETF) or sector peers like XLF for broader context. Subscribe for weekly market recaps!