

Defiance Daily Target 2X Long HIMS ETF: Leveraged Play on Telehealth Volatility
HIMZ is the Defiance Daily Target 2X Long HIMS ETF, a leveraged exchange-traded fund designed to deliver 200% of the daily performance of Hims & Hers Health, Inc. (HIMS), a telehealth company focused on wellness, mental health, and personalized treatments in the consumer healthcare sector. Traders are watching HIMZ closely in March 2026 due to its extreme volatility amid HIMS’s regulatory scrutiny and market shifts in digital health, with recent price swings reflecting broader sector pressures.
This article provides a detailed technical analysis of HIMZ for March 2026, covering price trends, key support and resistance levels, critical indicators like RSI and MACD, and a short-term outlook to help retail traders navigate potential moves.

Current Price Trend in March 2026
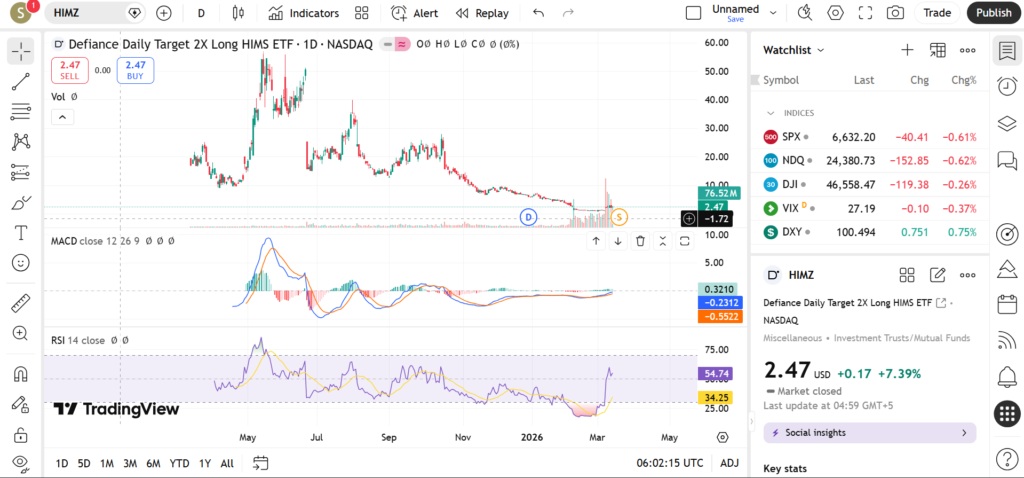
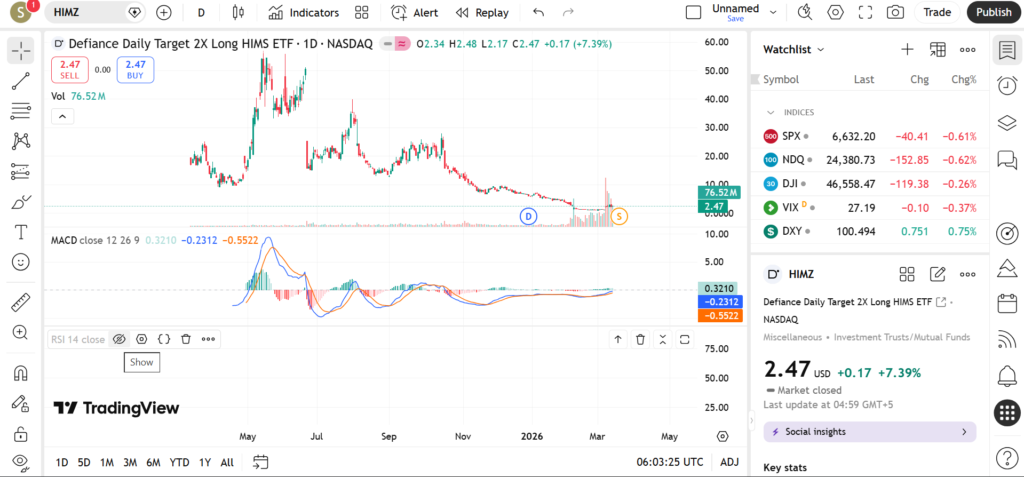
HIMZ has been in a pronounced downtrend throughout March 2026, characterized by sharp declines and failure to hold early-month gains. Recent price action shows the ETF trading around $2.40-$2.50 after plunging from highs near $3.00 earlier in the month, with lower lows and lower highs confirming bearish momentum.
The 20-day moving average sits well above the current price, acting as dynamic resistance, while the 50-day and 200-day MAs remain higher still, indicating no immediate bullish crossover. Major swings include a mid-month spike to $3.04 followed by a rejection, underscoring weak buying interest and sustained selling pressure.
Key Support and Resistance Levels
Support Levels:
- $2.17 – Recent daily low from March 12-14; a break below could signal accelerated downside toward inception lows.
- $2.00 – Psychological round number and approximate 52-week low zone; prior consolidation here might attract dip buyers.
- $1.50 – Gap fill from early 2026 volatility; aligns with projected 3-month decay in leveraged ETFs.
- $1.20 – 52-week absolute low; historical support where volume previously spiked.
Resistance Levels:
- $2.48 – Intraday high from March 14; recent swing high that capped upside.
- $2.70 – March 11 close level; previous session’s body where sellers emerged strongly.
- $3.00 – Mid-month peak and round number; break above might indicate short-term stabilization.
- $3.40 – Near 20-day MA; confluence with prior rally highs.

A decisive break below $2.17 support could signal further downside, potentially targeting $2.00 as bears gain control, while a push above $2.70 resistance might suggest a relief rally, though leveraged decay limits sustained upside.
Indicators – RSI, MACD, Volume
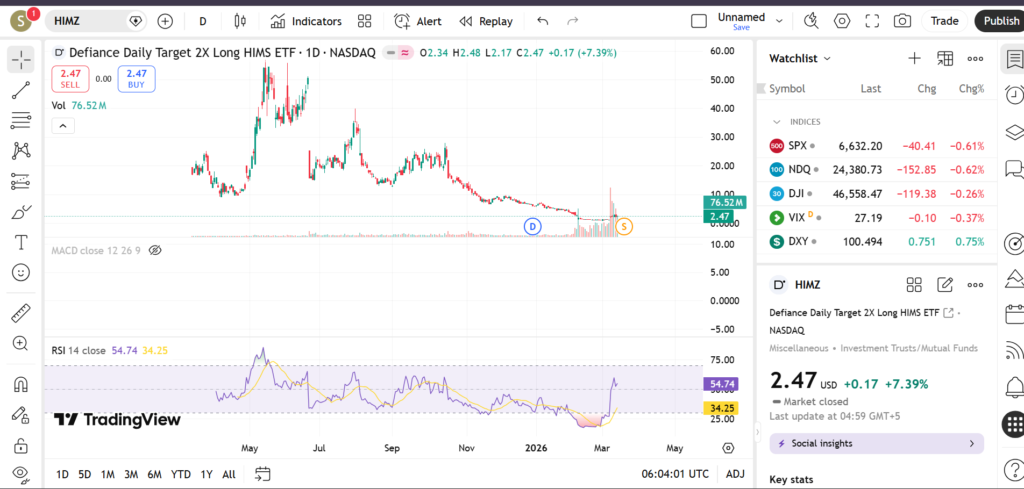
RSI (14-period) on HIMZ is hovering in oversold territory below 30 in March 2026, hinting at potential short-term exhaustion in selling pressure but no immediate reversal confirmed without divergence. This level often precedes bounces in volatile ETFs, though it can remain oversold during strong downtrends.
MACD shows a bearish signal with the line below the signal line and fading histogram momentum, reflecting declining downside velocity but still negative overall; no bullish crossover in sight. Volume has spiked dramatically on down days, with 76M+ shares on recent sessions versus average, indicating strong selling conviction, while rallies show dwindling participation.

Short-Term Outlook for HIMZ in March 2026
The technical picture for HIMZ remains bearish in March 2026, with downtrend intact, oversold RSI offering faint bounce hopes, but heavy volume on declines and distant moving averages capping optimism. Leveraged structure amplifies HIMS weakness, pressuring traders to monitor for stabilization near key supports.
What traders are watching:
- Break below $2.17 support amid HIMS earnings or regulatory updates.
- Volume dry-up on pullbacks signaling potential base formation.
- RSI divergence above 30 for early reversal clues.
- Macro catalysts like Fed comments impacting growth stocks.
- HIMS sector peers for correlated moves in telehealth ETFs.
Risks and Important Notes
Technical levels in leveraged ETFs like HIMZ can fail abruptly due to unexpected news, such as HIMS guidance misses, broader market selloffs, or volatility spikes from daily resets. Retail traders should consider the amplified risks of 2X leverage, including compounding decay over time, and use position sizing to manage exposure.
Past performance does not predict future results, and this analysis is for educational purposes only—not personalized financial advice.
For deeper insights, check our technical analysis on related leveraged ETFs or HIMS competitors. Stay informed and trade smart—bookmark our ETF section for daily updates.