

Analyze SPXS ETF price trends, technical analysis, and 2026 forecast. Is SPXS ETF a buy during market peaks? Get inverse strategy insights and S&P 500 bear case data.
Introduction
SPXS ETF seeks 3x inverse daily performance of S&P 500 index. It profits when stocks fall sharply. Investors eye SPXS ETF now amid record S&P highs in March 2026.
Rate cut delays spark caution. Broader euphoria risks pullbacks affecting SPXS ETF price.
Latest ETF Price & Trend
Last market close March 3, 2026 showed SPXS ETF around $36.50. Down 2.85% that day as S&P rose. Range spanned $35.78 to $37.77 intraday.


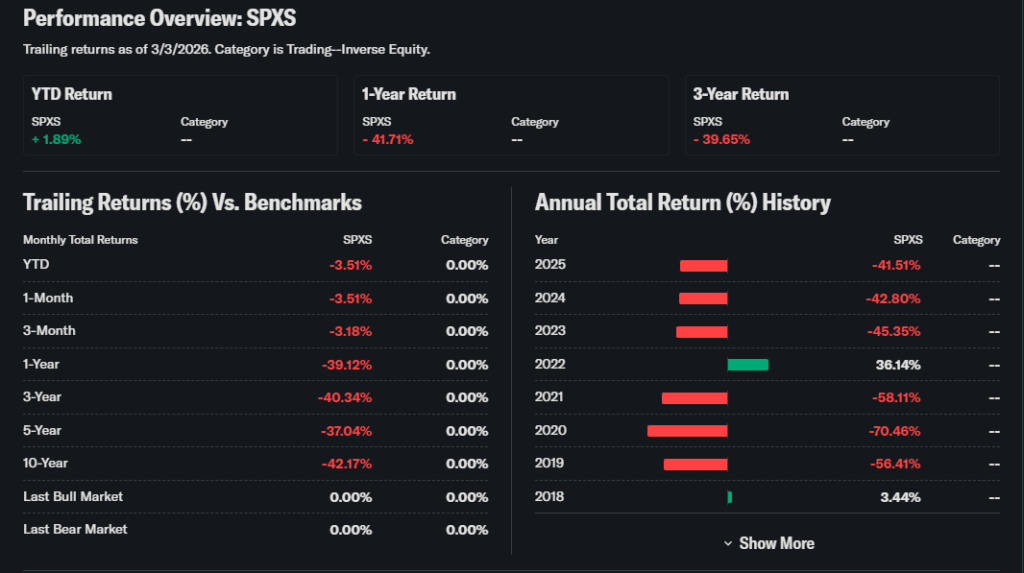
Five-day trend fell 5.2% with bull market. One-month down 8.1%. Three-month declined 15.4%.
Six-month drop near 22%. Year-to-date 2026 lost 1.89%. 52-week high $42.10, low $29.80.
Bearish trend for SPXS fits strategy. Gains come from S&P weakness, signaling tactical timing needs.
Technical Analysis
Support near $35 tests downside. Below eyes $33. Resistance at $38 limits rallies.

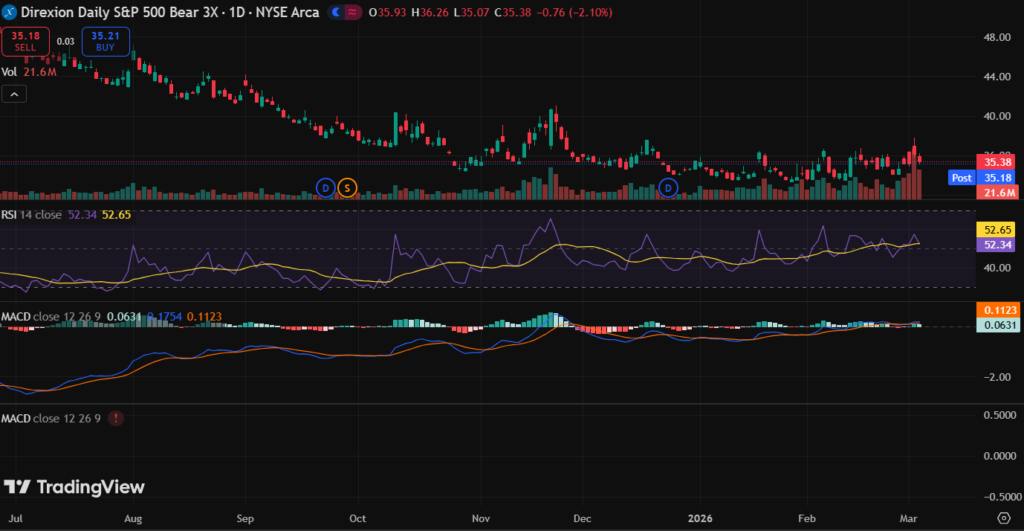
RSI at 35 flags oversold bounce risk. MACD bearish but fading. 50-day average below 200-day death cross pattern.
Volume spiked 48.76 million shares on declines. High activity validates SPXS ETF technical analysis moves.
Analyst Ratings & Price Targets
Leveraged inverse ETFs avoid ratings. SPXS thrives on volatility, not fundamentals. No traditional targets apply.
Direxion warns daily use only. Wall Street views SPXS ETF forecast as hedging tool, not long hold.
Pros stress short-term tactical plays.
Insider Activity
SPXS ETF has no insiders as derivatives fund. Sponsor flows steady for creations/redemptions.
No corporate activity. Focus stays on S&P direction.
Valuation Analysis
No P/E ratios for inverse funds. SPXS tracks -3x S&P daily. Decay erodes multi-day holds.

Expense ratio 1.07%. NAV tight to market price. No debt, pure swap exposure.
Compared to SQQQ Nasdaq bear, SPXS fairly valued for broad market bets.
Recent Earnings & Catalysts
ETFs report no earnings. SPXS gains from S&P pullbacks. Q4 2025 volatility lifted 10% briefly.
Catalysts include rate surprises, earnings misses. S&P rallies crushed SPXS 15% post-rally.
Bullish Case
Recession fears spike. Margin calls hit bulls. Volatility VIX jumps above 25.
Forced selling creates cascades. SPXS captures 3x downside fast.
Bearish Case
S&P bull run continues. Compounding decays value. Low volatility grinds lower.
Trend-following fails in rallies. Regulatory leverage caps hurt.
Market Sentiment & Investor Psychology
Short interest high at 5%. Puts dominate for S&P bulls. Institutions use sparingly at 45%.
Retail chases momentum poorly. Fear bias suits SPXS. Sentiment favors caution trades.
Short-Term Outlook
Technicals eye support test. Volume confirms S&P direction. Momentum tied to indices.
SPXS ETF price range $34-38 likely.
Medium to Long-Term Outlook
SPXS ETF built for daily resets. Decay destroys long holds. Strong in crashes only.
Financials sound but purpose tactical. Active traders watch, never accumulate.
FAQ Section
Is SPXS ETF a buy right now?
Tactical buy near S&P peaks. Daily use only.
What is the price target for SPXS ETF?
No targets. Volatility driven.
What are major risks for SPXS ETF?
Decay, prolonged rallies.
SPXS ETF forecast 2026?
Choppy gains in downturns.
SPXS ETF technical analysis?
Oversold RSI eyes bounce.
Suggestions
- Compare with SOXS Nasdaq bear
- See our volatility trading guide
- Read leveraged ETF risks
Conclusion
Watchlist SPXS ETF. Perfect for short-term S&P declines. Avoid long holds due to decay.
Disclaimer: This article is for informational purposes only and not financial advice.