

Track BOIL ETF price swings, technical analysis, and 2026 forecast. Is BOIL ETF a buy amid natgas rallies? Get leveraged insights, risks, and energy trends.
Introduction
BOIL ETF seeks 2x daily performance of natural gas futures. It amplifies gains and losses from Bloomberg Natural Gas Index. Investors watch BOIL ETF now with winter demand and storage reports in 2026.
Cold weather spikes usage. Geopolitical supply risks boost BOIL ETF price in energy trading.
Latest ETF Price & Trend
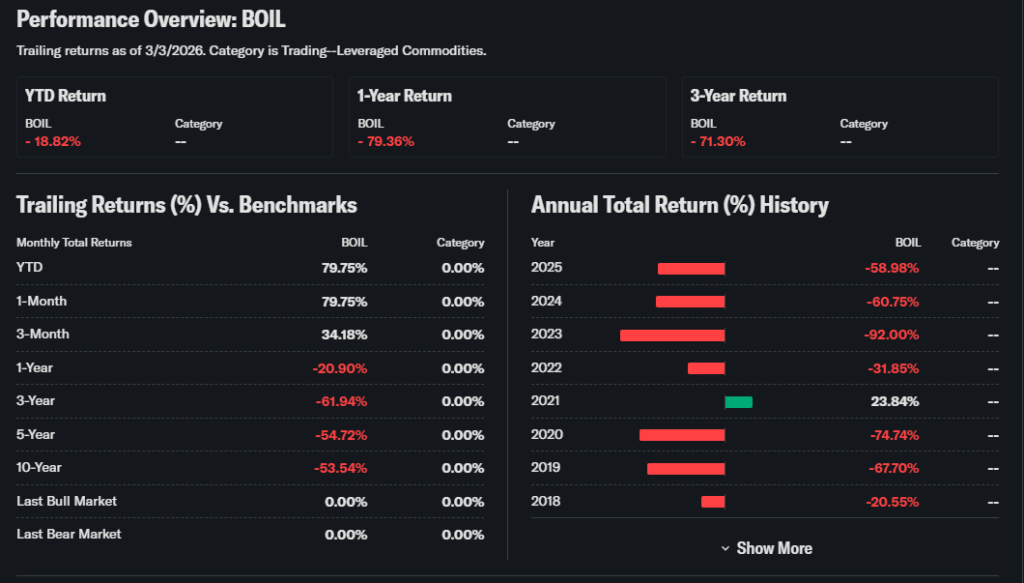
Last market close March 3, 2026 showed BOIL ETF at $18.59. Up 4.50% that day on gas rally. Range hit $17.88 to $20.17 recently.


Five-day trend gained sharply 19.55% from February lows near $15.55. One-month up but volatile -11.81% net.
Three-month down 52.47% from December peaks. Year-to-date 2026 mixed at 23.94%. 52-week $15.20 low to $109.77 high.
Wildly volatile trend fits leveraged play. Investors face amplified swings tied to natgas futures.
Technical Analysis
Support at $17.79 holds recent lows. Below tests $15.20 bottoms. Resistance near $20.17 blocks upside.


RSI nears 60, momentum building but not overbought. MACD shows buy signals from recent cross. 50-day average rising above 200-day cautiously.
Volume jumped to 4 million shares. Spikes validate moves in BOIL ETF technical analysis.
Analyst Ratings & Price Targets
Leveraged ETFs skip ratings. Gas futures imply BOIL targets $25-40 on rallies. ProShares stresses daily horizon.
No Wall Street calls. BOIL ETF forecast hinges on natgas $3-4 range. Tactical sentiment only.
Insider Activity
BOIL ETF uses derivatives, no insiders. Sponsor creations steady on demand. No unusual flows noted.
Activity neutral as futures tracker.
Valuation Analysis
No P/E for commodity leveraged funds. BOIL tracks 2x natgas futures daily. Decay hits multi-day holds.

Expense ratio 0.95%. NAV tracks tightly. No debt, swap-based structure.
Versus UNG plain gas ETF, BOIL amplifies but risks more.
Recent Earnings & Catalysts
ETFs report no earnings. Storage draws beat estimates recently. Cold snaps lifted natgas 7.35%.
Catalysts include weather, exports. Rallies boosted BOIL ETF 4.56% sessions.
Bullish Case
Winter demand surges. Export facilities ramp LNG. Supply disruptions lift futures.
Cold forecasts multiply gains. Short covering accelerates.
Bearish Case
Mild weather fills storage. Shale production floods. Contango erodes value.
Leverage decay grinds lower. Volatility crushes holders.
Market Sentiment & Investor Psychology
Short interest high 8%. Calls surge on rallies. Institutions trade actively 55%.
Retail loves momentum swings. Bull bias in cold snaps. Sentiment volatile optimistic.
Short-Term Outlook
Technicals favor upside tests. Volume backs rallies. Weather drives momentum.
BOIL ETF price eyes $20 resistance.
Medium to Long-Term Outlook
BOIL ETF suits short trades only. Natgas demand grows 2%. High volatility position.
Decay destroys holds. Traders watch weather, never accumulate.
FAQ Section
Is BOIL ETF a buy right now?
Tactical on cold forecasts. Daily resets key.
What is the price target for BOIL ETF?
$25-40 on natgas rallies.
What are major risks for BOIL ETF?
Decay, mild weather.
BOIL ETF forecast 2026?
Volatile swings $15-45 range.
BOIL ETF technical analysis?
MACD buy, volume rising.
Suggestions
- Compare with SOXS natgas ETF
- See our energy weather trading
- Read leveraged commodity risks
Conclusion
Watchlist BOIL ETF. Thrives in gas spikes but decays fast. Trade short-term only.
Disclaimer: This article is for informational purposes only and not financial advice.