

On-page H1: SPDN – Direxion Daily S&P 500 Bear 1X Shares Technical Analysis March 2026
The Direxion Daily S&P 500 Bear 1X Shares (SPDN) is an inverse ETF aiming for 100% of the opposite daily performance of the S&P 500 Index, popular for hedging bull markets in the broad equity sector. Traders monitor SPDN now as S&P 500 strength pressures inverse plays, especially amid 2026 economic data releases.
This analysis details March trends, supports/resistances, RSI/MACD/volume signals, and outlook for retail traders navigating bearish equity bets.

Current Price Trend in March 2026
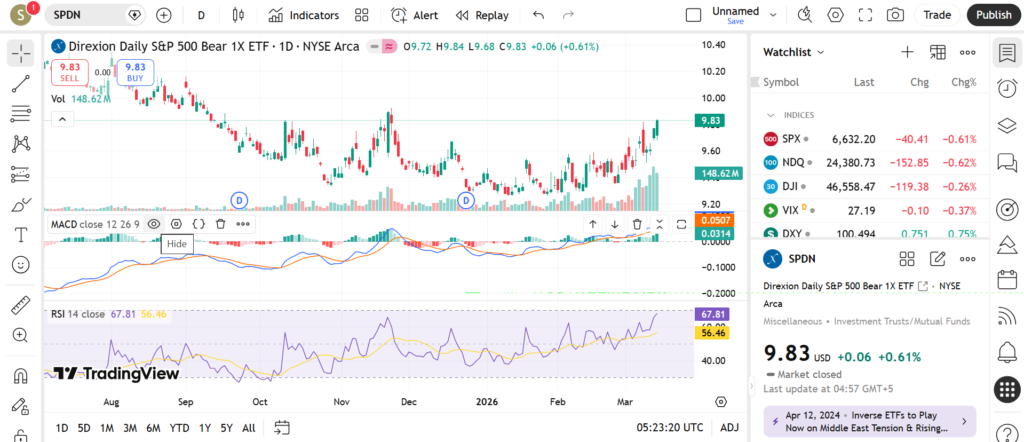
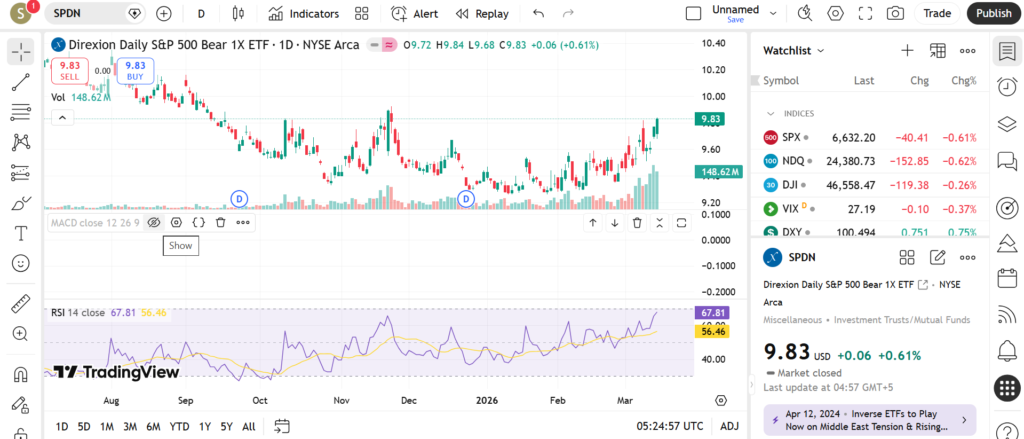
SPDN shows a short-term uptrend in early March 2026, climbing from around $9.68 lows to $9.83-$9.85, buoyed by any S&P pullbacks. It trades near or above short-term averages like 20-day around $9.70, but below 50-day at $9.43 and 200-day near $9.80, suggesting choppy momentum with recent swings higher.
Price action features higher lows near $9.68, with failure to break $10 keeping it range-bound, educating traders on inverse dynamics tied to index moves.
Key Support and Resistance Levels
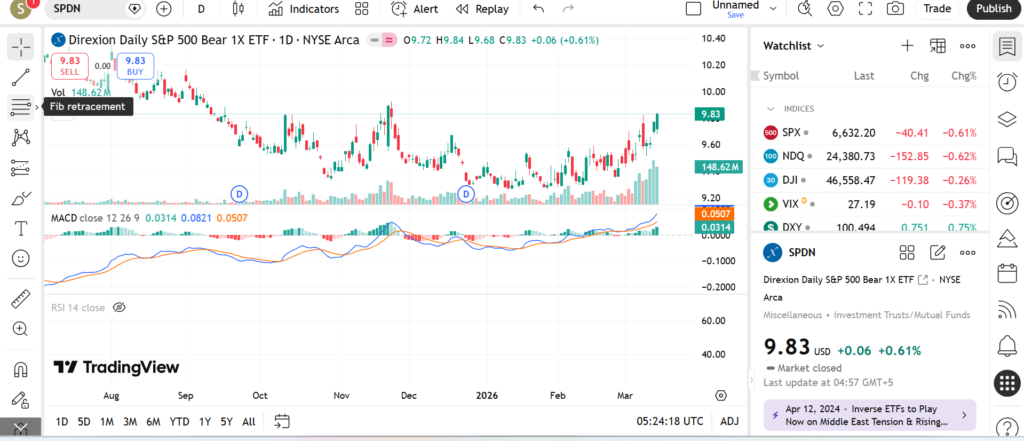
Supports for SPDN cluster at $9.41, matching 60-day MA and prior lows, $9.22 Fibonacci level, and $9.68 recent session low. Round $9.00 adds psychological support from historical bases.
Resistances include $9.82 immediate overhead, $9.85 daily high, and $10.00 psychological barrier near prior closes. Breaking above $9.85 could signal stronger inverse rally toward $10.20, while breach below $9.41 might indicate S&P rebound fading the uptick.

Indicators – RSI, MACD, Volume
RSI(14) at 67.81 points to neutral nearing overbought, warranting caution on further gains without confirmation. MACD(12,26) at 0.08 delivers a buy signal with positive momentum, though Stochastic at 80.89 hints at pullback risk.

Volume rises modestly on up days like March 12-14 spikes to 175M shares, supporting the push but needing sustained interest.
Short-Term Outlook for SPDN in March 2026
SPDN’s setup leans mildly bullish short-term in March, with MACD buy and price above key supports, but overbought RSI and S&P resilience cap potential. Inverse nature means traders watch equity weakness for continuation.
- S&P 500 drop below 5500 could propel SPDN past $9.85.
- RSI divergence above 70 might signal reversal to $9.41 support.
- Fed rate decisions or CPI data as macro catalysts.
- Volume surge on breaks for conviction.
- Equity earnings season impacting index direction.
Risks and Important Notes
Unexpected S&P rallies or positive macro news can invalidate inverse levels quickly, emphasizing the daily reset risks of leveraged/inverse ETFs. This is for education; manage position sizes and avoid treating as advice.
Dive into related reads on MSTX or BITO for more inverse and sector plays.