

On-page H1: MSTX – Defiance Daily Target 2X Long MSTR ETF Technical Analysis for March 2026 Outlook
The Defiance Daily Target 2X Long MSTR ETF (MSTX) seeks daily investment results of 200% of the daily performance of MicroStrategy Incorporated (MSTR) stock, making it a leveraged play tied to MSTR’s Bitcoin-heavy balance sheet. Traders watch MSTX amid volatility in crypto-linked assets, especially as Bitcoin influences MSTR’s value, drawing interest from those betting on amplified moves in tech and digital assets sectors.
This article covers the short-term price trend, key support and resistance levels, RSI, MACD, and volume indicators for March 2026, plus a short-term outlook to help retail traders spot potential setups.

Current Price Trend in March 2026
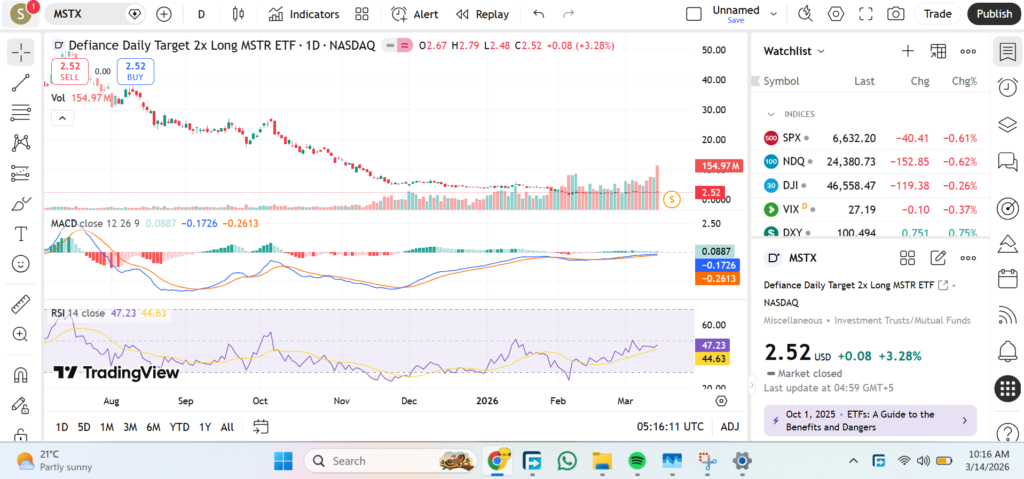
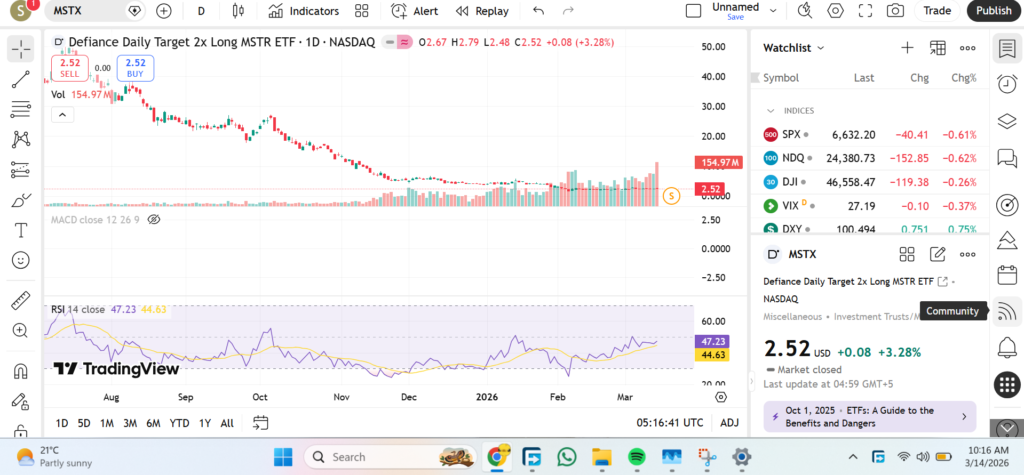
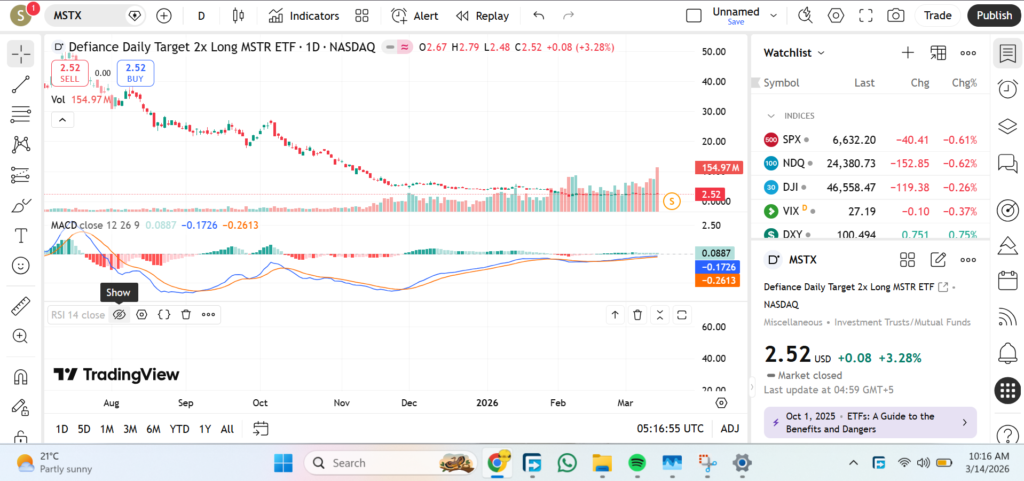
MSTX has been in a downtrend during early March 2026, with prices declining from around $2.81 on March 4 to lows near $2.41 by March 9, reflecting broader pressure on leveraged MSTR exposure. The ETF trades below its short-term moving averages, including estimates near the 20-day at $2.60 and 50-day around $3.00, while far under the 200-day average estimated near $20, confirming bearish momentum from major swings lower.
Recent price action shows lower highs and lows, with a swing low at $2.32 on March 6 testing prior supports, though failure to reclaim the $2.80 zone keeps sellers in control. Traders may watch for any stabilization above recent lows to signal potential range-bound trading.
Key Support and Resistance Levels
Key supports for MSTX include $2.06, a statistical one-standard-deviation level from recent volatility, and $1.92, aligning with strong prior lows and Fibonacci retracements. Additional support sits at $1.59, a deeper Fibonacci floor, and round number $2.00, which could act as psychological backing from previous March lows.
Resistances are at $2.60, matching recent highs and one-standard-deviation upper band, $2.57 immediate overhead from technical scans, and $2.87 from early March peaks. A break above $2.60 might indicate short-term bullish reversal toward $3.00, while a drop below $1.92 could signal further downside testing $1.59, potentially accelerating the downtrend.

Indicators – RSI, MACD, Volume
RSI(14) hovers in the 30-44 range, suggesting neutral to oversold conditions that could precede a bounce if buying emerges, though sustained below 50 favors bears. MACD shows bearish momentum with negative values around -0.47 and no bullish crossover, indicating fading upside potential.
Volume has spiked on down days, like high trading around March declines, but lacks conviction on minor rallies, pointing to distribution rather than accumulation.

Short-Term Outlook for MSTX in March 2026
The technical picture for MSTX remains bearish in March 2026, with prices below key moving averages, oversold RSI hints at possible relief, but MACD and volume confirm downward pressure tied to MSTR volatility. Traders may eye supports for bounces, but resistance caps limit upside without fresh catalysts.
- Break below $1.92 could target $1.59 amid Bitcoin or MSTR weakness.
- RSI rebound above 50 might signal pullback to $2.60 resistance.
- Watch MSTR earnings or Bitcoin macro moves for leveraged impact.
- Rising volume on upside could confirm trend shift.
- S&P 500 trends indirectly affect via market sentiment.
Risks and Important Notes
Technical levels like these can fail due to sudden news, such as regulatory shifts in crypto or MSTR-specific events, overriding chart patterns. Always use risk management, like stop-losses, and consider this educational—not personalized advice—as markets evolve rapidly.
For more insights, check our technical analysis on BITO or SPDN, or explore other leveraged crypto ETFs.