

Discover IWM ETF price, technical analysis, forecast, and if IWM ETF is a buy. Get insights on trends, ratings, and small-cap outlook as of March 2026.
Introduction
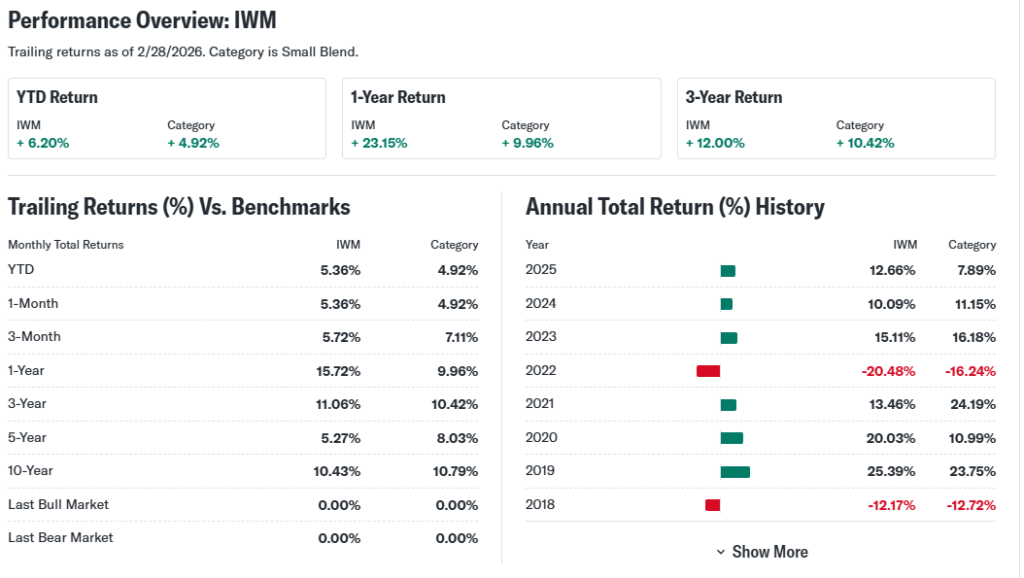
The IWM ETF tracks the Russell 2000 index of U.S. small-cap stocks. It holds about 1,943 companies with smaller market values.
Investors watch IWM ETF now due to small-cap rallies amid rate cut hopes. Broader markets favor large caps, but small caps gain on economic shifts.
Latest IWM ETF Price & Trend
IWM ETF closed at $265.99 on the last trading day. It opened at $262.10 with a day’s range of $259.77 to $262.76.


The 1-day performance showed a slight dip from prior highs. Over 5 days, it ranged from $258.10 to $266.23, down 1.81% at peak.
In the 1-month trend, IWM ETF moved from $255.05 to $268.96, ending down 2.81%. The 3-month trend rose 6.65% from $245.12 lows, near $271.60 high.
Six-month gains hit 14.20% from $228.90. Year-to-date, it climbed 6.32% from $245.86. The 52-week range spans $171.73 low to $271.60 high.
This sideways-to-bullish trend signals caution for investors. It hints at momentum but risks pullbacks near highs.
Technical Analysis
Support levels sit near $259, where prices often bounce. Resistance looms at $271.60, the recent high buyers struggle to break.


RSI at 47.67 shows neutral to oversold conditions. This measures speed of price changes; below 30 signals oversold buys, above 70 overbought sells.
MACD at 55.79 stays bullish as the line tops the signal. It spots trend changes via moving average differences; crossovers guide entry points.
The 50-day moving average hovers around recent trends; 200-day lags lower. No golden cross (50 over 200 bullish) or death cross yet. These averages smooth prices to spot trends.
Volume hit 40.6 million shares lately. Rising volume confirms trends; it shows conviction behind moves.
This chart highlights IWM ETF technical levels.
Analyst Ratings & Price Targets
Holdings earn a Moderate Buy rating from 305 analysts. About 10.2% of portfolio covered, leaning positive.
Average price target stands at $250.72, with high and low matching. Upside potential slim at 0.25% from recent close.
No major upgrades noted lately. Wall Street sees fair value in small caps now. This sentiment suggests hold for most investors.
Insider Activity
No recent open-market insider buys or sells reported for IWM ETF. ETFs rarely show direct insider trades like stocks.
Management activity trends quiet. This lacks clear confidence signals but avoids red flags. Watch holdings’ insiders instead.
Valuation Analysis
IWM ETF trails a P/E of 18.59. This blends holdings’ earnings multiples.

Forward P/E unavailable; price-to-sales not listed. Russell 2000 small caps show 22.57% past-year return.
Revenue and EPS growth tie to holdings’ YoY gains. Free cash flow and debt vary by company. Cash positions solid overall.
Compared to S&P 500 ETFs, IWM ETF looks fairly valued. Small caps trade cheaper than mega-caps like those in SPY. Not undervalued, but reasonable.
Recent Earnings & Catalysts
IWM ETF reflects holdings’ quarterly results. No single earnings; aggregate beats vary.
Rate cut expectations boost small caps. Sector rotation added $442M inflows recently.
Fed moves and trade talks act as catalysts. These lifted IWM ETF performance amid optimism.
Bullish Case
Small-cap revenue grows on domestic focus. Demand rises in recovery phases.
Tech edges and operations improve for holdings. Rate cuts favor borrowers. Steady growth possible.
Bearish Case
Competition heats from large caps. Growth slows if economy stalls.
Margin squeezes hit small firms. Regulation and recession risks loom. Churn possible in weak sectors.
Market Sentiment & Investor Psychology
Short interest data limited for ETFs. Institutional ownership tops 2,744 owners, holding 299M shares.
Inflows show optimism; big players like Bank of America add positions. Retail chases momentum.
Sentiment leans neutral to optimistic on rotation.
Short-Term Outlook
Technicals show neutral RSI and bullish MACD. Volume steady but not surging.
Momentum could push to resistance if markets hold. Expect sideways action near highs.
Medium to Long-Term Outlook
Strong index tracks diverse small caps. Industry growth aids if economy expands.
Financial health mixed; competitive edge in niches. Hold for long-term investors; accumulate on dips.
FAQ Section
Is IWM ETF a buy right now?
Moderate Buy rating, but near highs. Watch for pullbacks.
What is the IWM ETF price target?
Average $250.72, fair value per analysts.
What are major risks for IWM ETF?
Economic slowdowns, rate shifts, competition.
IWM ETF forecast for 2026?
Bullish on cuts, but volatile.
Suggestions
Compare with SOXS vs SPY analysis
See our small-cap ETF forecast
Read our Russell 2000 valuation breakdown
Conclusion
Hold IWM ETF. Fair valuation and rotation potential balance risks like slowdowns. Long-term growth viable for patient investors.
Disclaimer: This article is for informational purposes only and not financial advice.