
ETHA Technical Analysis: Trend, Levels & Outlook March 2026
The iShares Ethereum Trust ETF (ETHA) is an exchange-traded fund designed to provide investors with exposure to Ethereum, the second-largest cryptocurrency by market capitalization. By tracking the price performance of Ethereum through an ETF structure, ETHA allows traders and investors to gain exposure to the digital asset market without directly holding cryptocurrencies.
In March 2026, ETHA has been attracting significant attention as the cryptocurrency market continues to evolve with institutional participation, regulatory developments, and increased adoption of blockchain technologies. Ethereum’s role in decentralized finance (DeFi), NFTs, and smart contract ecosystems makes it one of the most actively traded crypto assets. This article analyzes ETHA’s current technical trend, key support and resistance levels, signals from indicators such as RSI, MACD, and volume, and the short-term outlook traders are watching.

Current Price Trend in March 2026
During March 2026, ETHA has been showing moderate volatility consistent with movements in the cryptocurrency market. Crypto-linked ETFs often follow the same trend patterns as the underlying asset, meaning Ethereum’s price action plays a key role in determining ETHA’s direction.
The ETF has recently been trading within a short-term consolidation phase following a prior rally, suggesting that traders are evaluating whether the next move will be a continuation of the broader uptrend or a deeper correction.
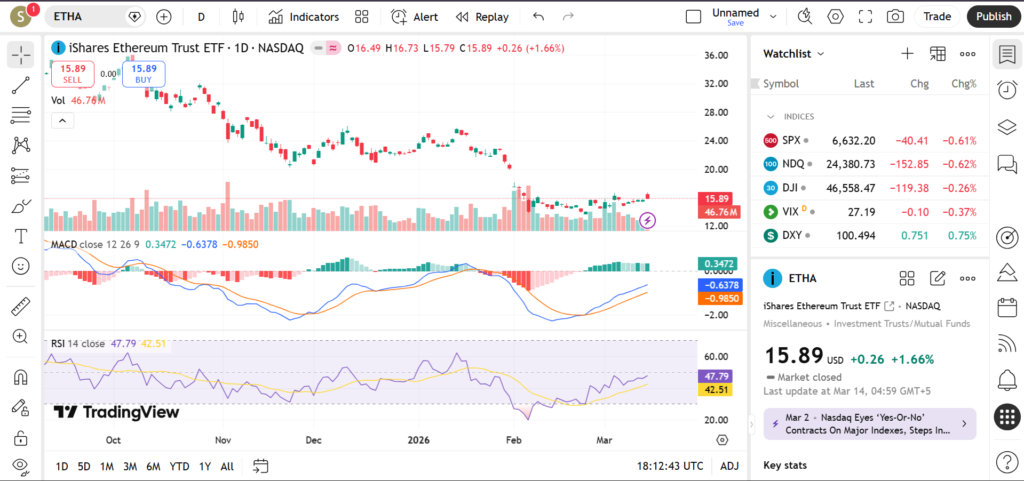
The 20-day moving average has been acting as a short-term trend guide, with ETHA frequently testing this level during recent sessions. When price remains above this moving average, it often suggests that short-term bullish momentum is still present.
The 50-day moving average sits slightly below recent highs and represents an important medium-term trend indicator. If ETHA continues to trade near this level, it may indicate that the ETF is stabilizing after recent price fluctuations.
The 200-day moving average is widely followed by institutional traders as a long-term trend indicator. As long as ETHA maintains price action above this level, the broader bullish trend seen during previous crypto market cycles could remain intact.
Recent price swings show alternating periods of upward momentum followed by pullbacks, which is typical for crypto-related assets as traders react to both technical signals and market sentiment.
Key Support and Resistance Levels
Support and resistance levels provide insight into where traders have historically reacted to price changes.
Important support levels for ETHA include:
- Recent consolidation low: The lowest point reached during the current trading range where buyers previously stepped in.
- 50-day moving average zone: This area often acts as dynamic support during sustained upward trends.
- Long-term trend support near the 200-day moving average: A critical level that could determine whether the broader trend remains bullish.


On the upside, several resistance levels are being monitored:
- Recent swing high: The highest point reached during the latest rally attempt.
- Prior breakout zone: A level where price previously accelerated upward before facing selling pressure.
- Psychological round-number resistance: Crypto-linked ETFs often react strongly near major price milestones.
If ETHA breaks above its recent swing high with increasing trading volume, it could suggest renewed momentum in Ethereum. Conversely, a move below the consolidation support zone might indicate that the market is entering a deeper correction phase.
Indicators – RSI, MACD, Volume
The Relative Strength Index (RSI) currently appears to be fluctuating within the neutral range, which typically indicates that the ETF is neither overbought nor oversold. Neutral RSI conditions often occur during consolidation phases when traders are waiting for new catalysts.
The MACD indicator has shown alternating bullish and bearish signals as the ETF’s momentum shifts alongside the broader cryptocurrency market. When the MACD line crosses above the signal line, it often suggests strengthening upward momentum, while a downward crossover can indicate fading bullish pressure.
Volume activity in ETHA has increased during periods of strong price movement. These spikes in trading activity usually occur when Ethereum experiences large market swings, reflecting heightened interest from both retail and institutional participants.


Because crypto markets operate around the clock, ETF volume spikes during market hours can sometimes represent delayed reactions to overnight movements in the underlying cryptocurrency.
Short-Term Outlook for ETHA in March 2026
The technical outlook for ETHA in March 2026 appears balanced between bullish long-term sentiment and short-term consolidation. The ETF remains sensitive to developments in the cryptocurrency market, particularly Ethereum network upgrades, institutional investment flows, and broader risk sentiment.
If ETHA holds above key support zones and breaks above recent resistance levels, the ETF could potentially resume an upward trend. However, continued consolidation may occur if the broader crypto market remains range-bound.
What traders are watching:
- Break above the most recent swing high for confirmation of bullish momentum
- Whether price holds above the 50-day moving average during pullbacks
- Institutional inflows into crypto ETFs
- Ethereum network developments and upgrades
- Broader cryptocurrency market sentiment
Risks and Important Notes
Cryptocurrency-linked ETFs can experience significant volatility, especially when digital asset prices move rapidly due to regulatory news, macroeconomic developments, or technological changes.
Technical levels may fail during sudden market shifts, and crypto markets are known for rapid sentiment changes.
This analysis is intended for educational purposes only and does not represent personalized financial advice. Traders should consider their own risk tolerance and conduct independent research before making trading decisions.
For additional insights, readers may explore technical analysis of other cryptocurrency ETFs, blockchain-related stocks, and digital asset funds to better understand broader market trends.