
SCHD ETF analysis, price trends, forecast, risks, and outlook. Is SCHD ETF a buy? Full breakdown of dividend growth investing strategy.
Data as of April 21, 2026, 16:00 UTC — using last market close data from publicly available ETF trackers and market data platforms.
Introduction
The SCHD ETF, known as the Schwab U.S. Dividend Equity ETF, is a popular dividend-focused ETF that tracks the Dow Jones U.S. Dividend 100 Index. ()
It invests in large, financially strong U.S. companies with consistent dividend payments, making it a core holding for income-focused investors.
Investors are focusing on SCHD ETF due to rising interest in stable income, especially in uncertain economic conditions where growth stocks can be volatile.
Unlike high-growth ETFs, SCHD ETF emphasizes dividend sustainability, value investing, and long-term total return.
Latest SCHD ETF Price & Trend
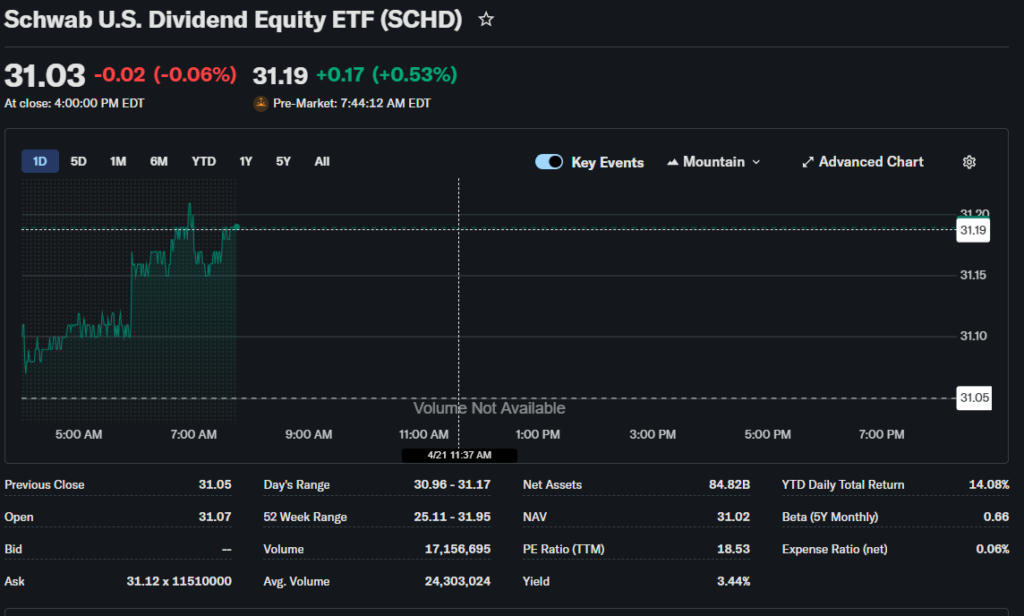
As of the latest market close, SCHD ETF price is approximately $30.80 based on recent NAV data. ()
The ETF has traded in a relatively tight range in recent sessions, reflecting stability compared to broader markets.
Over the past 5 days, SCHD ETF has remained mostly sideways with minor fluctuations.
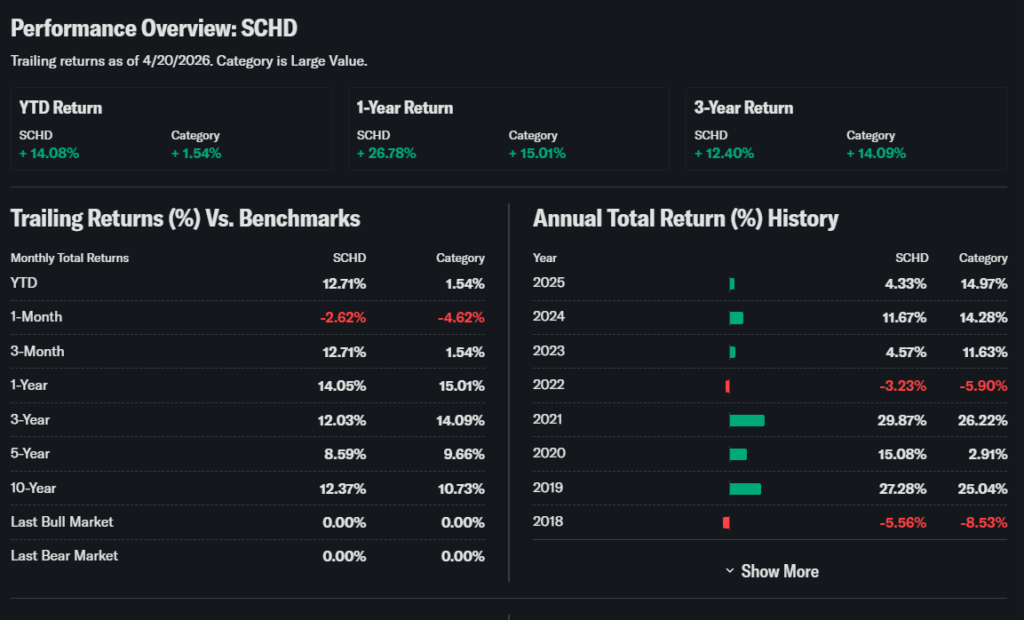
The 1-month trend shows a slight pullback of around -2.6%, indicating short-term consolidation. ()
The 3-month trend is strong, with gains of over +12%, showing a recovery phase. ()
Over the last 6 months, SCHD ETF has shown steady upward movement with low volatility.
Year-to-date performance is also positive, reflecting strong demand for dividend-paying stocks.
The 52-week high is around $31.95, while the 52-week low is near $24.76. ()
Overall trend is moderately bullish with strong stability.
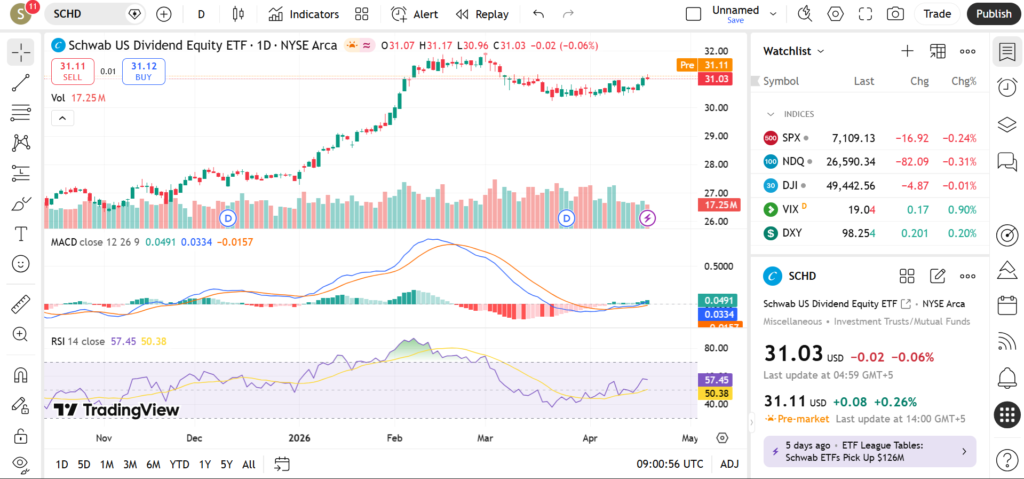
Technical Analysis
SCHD ETF technical analysis shows support near $29.80.
Resistance is around $31.90, close to the 52-week high.
The RSI is around 55, indicating balanced momentum.
The MACD is slightly bullish, suggesting gradual upward trend continuation.
The 50-day moving average is near $30.20, and the ETF trades slightly above it.
The 200-day moving average is around $28.50, confirming long-term strength.
No extreme overbought or oversold signals are present.
Volume remains steady, reflecting strong institutional participation.
Analyst Ratings & Price Targets
SCHD ETF does not have traditional analyst ratings.
However, dividend-focused strategies are widely supported by financial advisors for long-term portfolios.
Market expectations suggest steady appreciation combined with consistent income generation.
Insider Activity
SCHD ETF does not have insider trading.
Fund flows show consistent inflows, especially during periods of market uncertainty.
Institutional investors prefer SCHD ETF for stability and yield.
Valuation Analysis
SCHD ETF has a portfolio P/E ratio around 20, indicating reasonable valuation for large-cap dividend stocks. ()
The ETF focuses on companies with strong return on equity and cash flow metrics.
Dividend yield is around 3.3% to 3.4%, making it attractive for income investors. ()
Compared to growth ETFs, SCHD ETF is less expensive and more stable.
Overall, SCHD ETF appears fairly valued with a slight undervaluation compared to growth-heavy indices.
Recent Earnings & Catalysts
SCHD ETF does not report earnings directly.
Performance depends on earnings of its underlying holdings such as large U.S. corporations.
Key catalysts include dividend growth, corporate earnings stability, and macroeconomic trends like interest rates.
Bullish Case
Strong dividend yield attracts income investors.
High-quality companies provide stability.
Lower volatility compared to growth stocks.
Suitable for long-term compounding.
Bearish Case
Limited high-growth potential compared to tech ETFs.
Interest rate increases may reduce demand for dividend stocks.
Sector concentration could limit diversification benefits.
Market Sentiment & Investor Psychology
Market sentiment toward SCHD ETF is positive but conservative.
Institutional investors continue to accumulate dividend ETFs.
Retail investors use it for passive income strategies.
Sentiment is stable rather than speculative.
Short-Term Outlook
SCHD ETF is expected to trade within a range.
Break above $31.90 could lead to gradual upside.
Below $29.80 may indicate temporary weakness.
Medium to Long-Term Outlook
SCHD ETF remains a strong long-term investment for income and stability.
Dividend growth and compounding make it attractive for long-term investors.
It is suitable as a core portfolio holding.
FAQ Section
Is SCHD ETF a buy right now?
SCHD ETF is a strong long-term buy for income and stability.
What is the SCHD ETF price target?
Gradual upside toward $32–$35 range over time.
What are major risks for SCHD ETF?
Interest rate changes and slower growth.
What drives SCHD ETF performance?
Dividend growth and large-cap earnings.
Suggestions
Compare with dividend ETF strategies
See value investing outlook
Read income portfolio guide
Conclusion
SCHD ETF is a reliable dividend-focused ETF offering steady income and moderate growth.
It is well-suited for long-term investors seeking stability and consistent returns.
Disclaimer: This article is for informational purposes only and not financial advice.