TSDD ETF analysis, price trends, forecast, risks, and outlook. Is TSDD ETF a buy? Full breakdown of inverse Tesla leveraged exposure.
Data as of April 21, 2026, 16:00 UTC — using last market close data from publicly available ETF trackers and market data platforms.
Introduction
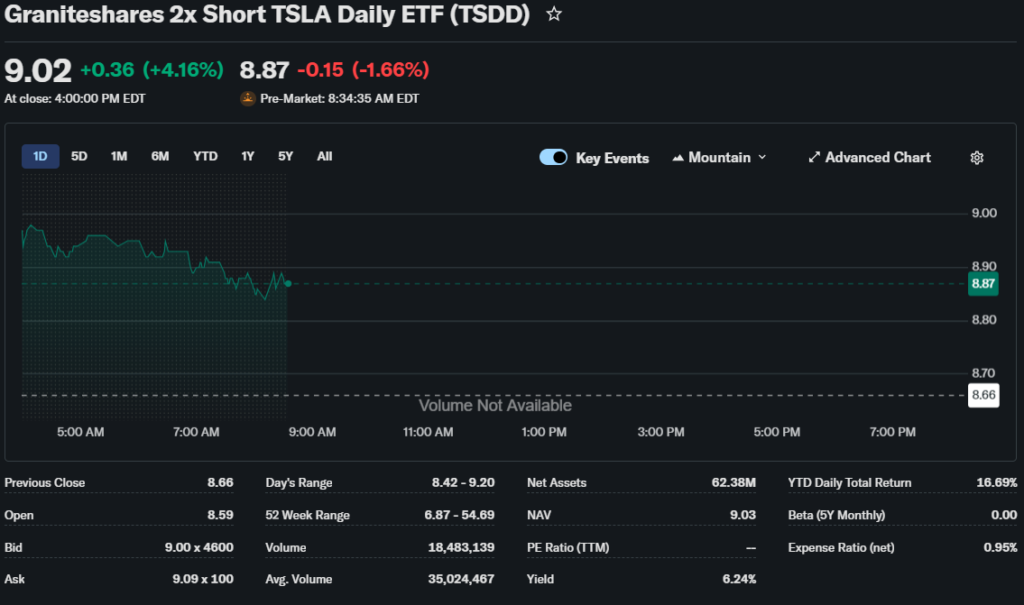
The TSDD ETF, known as the GraniteShares 2X Short TSLA Daily ETF, is a leveraged inverse ETF designed to deliver -2x the daily performance of Tesla stock.
This ETF is mainly used by traders who want to profit from declines in Tesla’s stock price.
Due to its leveraged structure, TSDD ETF is not intended for long-term holding but rather for short-term trading strategies.
Investor interest in TSDD ETF increases during periods of Tesla volatility and broader tech sector uncertainty.
Latest TSDD ETF Price & Trend
As of the latest available market data, TSDD ETF price is around $9.00–$9.45 range.
The ETF showed recent declines, reflecting strength in Tesla stock.
Over the past 5 days, TSDD ETF has been volatile with downward pressure.
The 1-month trend is slightly positive but unstable.
The 3-month trend is negative due to Tesla’s upward momentum.
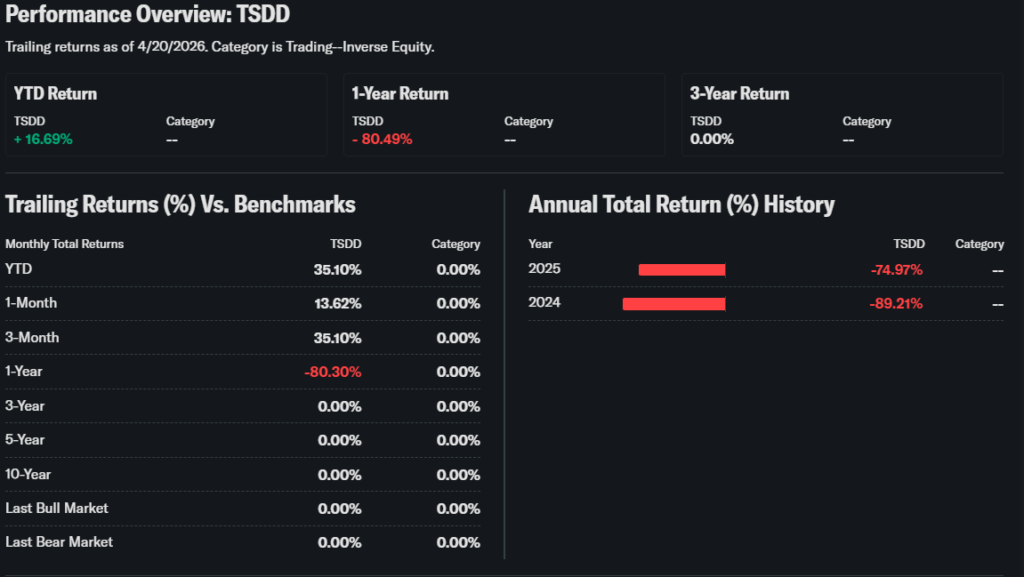
Over the last 6 months, TSDD ETF has declined significantly.
Year-to-date performance remains weak.
The 52-week high is extremely high near $91.68, while the 52-week low is around $6.87.
Overall trend is bearish for TSDD ETF, indicating a bullish trend in Tesla stock.
Technical Analysis
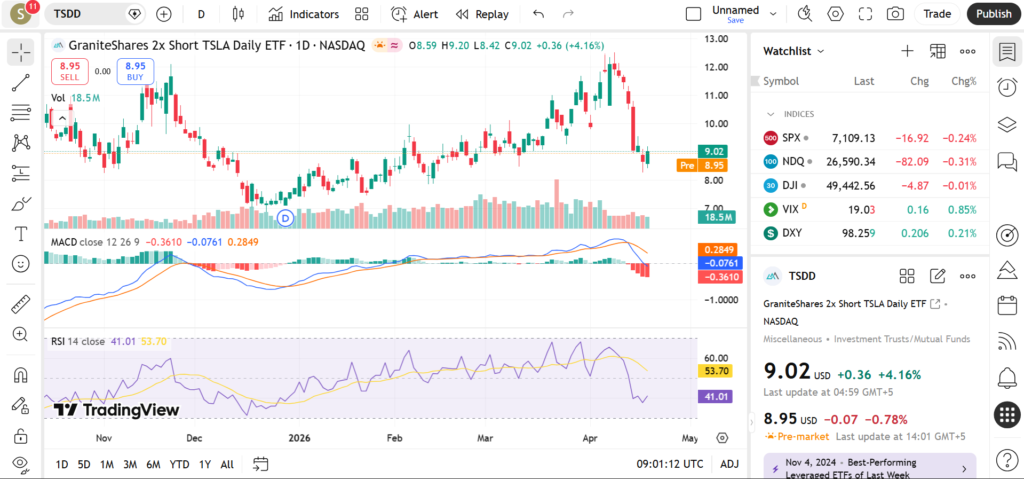
TSDD ETF technical analysis shows support near $8.50.
Resistance is around $10.50.
The RSI is around 40, indicating weak momentum.
The MACD remains bearish, confirming downward pressure.
The 50-day moving average is above the current price, acting as resistance.
The 200-day moving average also signals a long-term downtrend.
Volume is high due to active trading.
Analyst Ratings & Price Targets
TSDD ETF does not have analyst ratings.
Price targets are not meaningful due to its leveraged inverse structure.
Performance depends entirely on Tesla stock movement.
Insider Activity
No insider activity applies.
Trading is driven by short-term speculative activity.
Valuation Analysis
TSDD ETF has no traditional valuation metrics.
Its value is derived from derivatives tracking Tesla’s daily performance.
Expense ratio is around 0.95%, which is relatively high.
The ETF is considered a trading instrument, not an investment based on fundamentals.
Recent Earnings & Catalysts
TSDD ETF does not report earnings.
Key catalysts include Tesla earnings, EV market trends, and macroeconomic conditions.
Bullish Case
TSDD ETF gains when Tesla stock declines.
Market corrections in tech can drive strong upside.
Short-term volatility creates trading opportunities.
Bearish Case
If Tesla stock rises, TSDD ETF loses value.
Leverage decay reduces long-term returns.
High volatility increases risk.
Market Sentiment & Investor Psychology
Sentiment is highly speculative.
Retail traders dominate activity.
Institutional participation is limited.
Short-Term Outlook
TSDD ETF may rise if Tesla faces short-term weakness.
Break above $10.50 could signal recovery.
Below $8.50 may indicate further downside.
Medium to Long-Term Outlook
TSDD ETF is not suitable for long-term holding.
Leverage decay and compounding reduce returns over time.
Best used for short-term trading strategies.
FAQ Section
Is TSDD ETF a buy right now?
Only for short-term bearish trades on Tesla.
What is the TSDD ETF price target?
Depends on Tesla stock movement.
What are major risks for TSDD ETF?
Leverage decay and volatility.
What drives TSDD ETF performance?
Tesla stock and market sentiment.
Suggestions
Compare with inverse ETF strategies
See Tesla stock forecast
Read high-risk trading guide
Conclusion
TSDD ETF is a high-risk leveraged inverse ETF designed for short-term trading.
It is not suitable for long-term investors due to extreme volatility and decay effects.
Disclaimer: This article is for informational purposes only and not financial advice.