

State Street Financial Select Sector SPDR ETF (XLF) Technical Analysis – Bearish Momentum Meets Key Supports
The State Street Financial Select Sector SPDR ETF (XLF) tracks the Financial Select Sector Index, providing targeted exposure to U.S. financial giants like banks, insurers, and asset managers, including heavyweights such as JPMorgan Chase, Berkshire Hathaway, and Goldman Sachs. In March 2026, traders are glued to XLF amid regulatory shifts under President Trump’s pro-business policies, volatile interest rates, and bank earnings season, as financials often lead or lag broader market rotations. This detailed analysis breaks down the short-term trend, critical support and resistance zones, RSI/MACD/volume signals, and actionable short-term outlook for retail traders seeking clarity in this high-beta sector ETF.
Financial sector ETFs like XLF amplify moves in rate-sensitive names, drawing scrutiny now with potential Fed pauses on cuts and fiscal stimulus debates influencing net interest margins (NIMs). As small-caps struggle and mega-banks report, XLF’s price action offers educational insights into sector rotation dynamics without dictating trades. We’ll explore moving average alignments, pivotal levels derived from recent swings, indicator readings, and scenarios traders might monitor.

Current Price Trend in March 2026
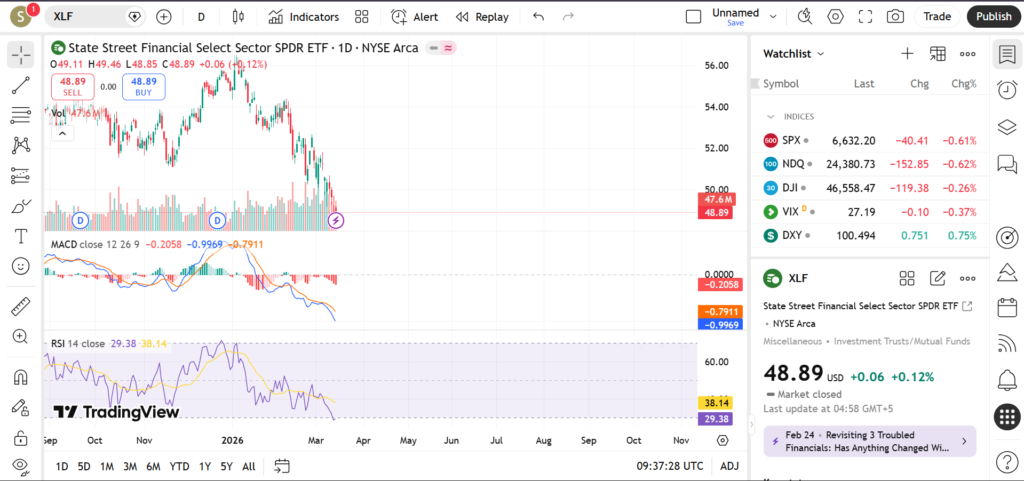
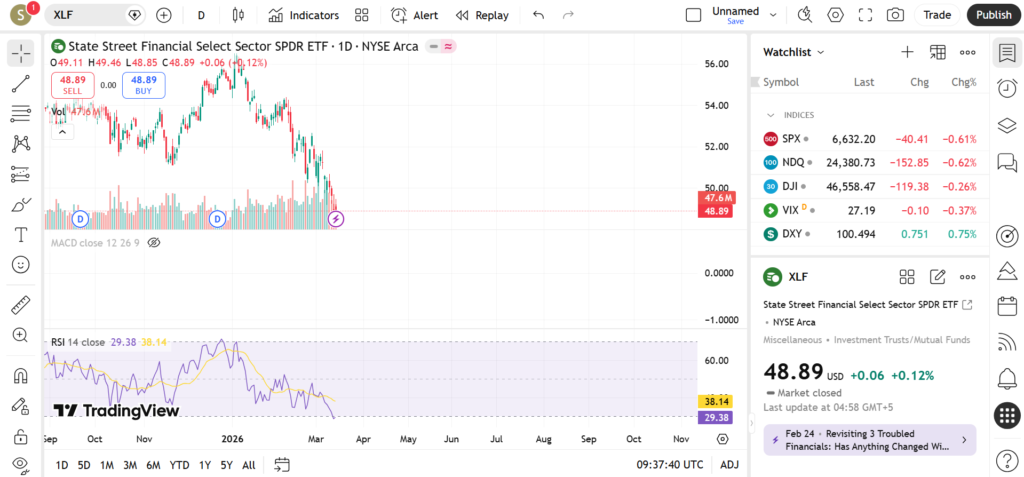
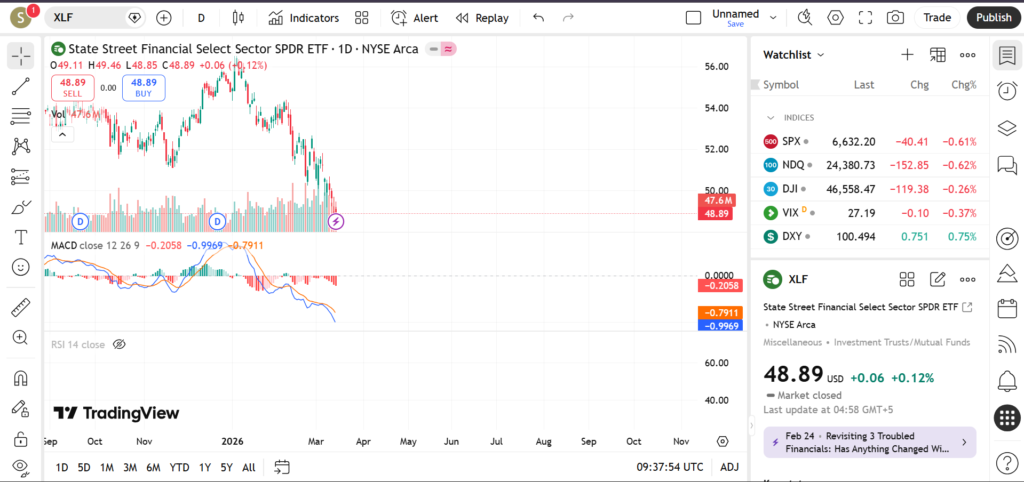
XLF is locked in a short-term downtrend during March 2026, characterized by lower highs and lower lows following a rejection from early-year peaks, with price trading well below key moving averages amid “strong sell” technical sentiment. Recent price action highlights a sharp multi-week decline from around the 53.00-54.00 zone—likely tied to hawkish Fed rhetoric and softer bank guidance—culminating in tests near 48.89 as of early March, underscoring bearish control.
The 20-day simple moving average sits at 51.11 (sell signal as price is below), the 50-day at approximately 52.50-53.00, and the 200-day near 52.82, all sloping downward and confirming bearish alignment; major swings include a February high near 53.94 (MA5 rejection) and a probe toward 48.00 lows. This configuration teaches retail traders about “death cross” risks when shorter MAs dip below longer ones, though oversold conditions hint at potential pauses rather than freefalls.
Volume has accompanied the downside, reinforcing the trend’s validity, while shallow bounces lack conviction— a classic sign of distribution in financial ETFs during uncertainty. Patient observation of MA fans (20/50/200 convergence) can signal if momentum exhausts near supports.
Key Support and Resistance Levels
Support levels for XLF in March 2026 cluster around pivot calculations, prior lows, and psychological floors, where institutional buying might emerge if sentiment stabilizes.
- Support near 48.80 (S1 pivot): Coincides with recent March lows around 48.89 and a minor swing low; a hold here could indicate short-term stabilization, while a break below might accelerate toward classic S2 at 47.29, signaling intensified bank sector weakness.
- Support at 47.30 (S2/Fibonacci): Aligns with deeper pivot S2 (47.29) and Fibonacci retracement from yearly highs; traders watch volume for absorption, as defense often precedes bounces in oversold financials.
- Support around 45.80 (S3): Classic triple pivot low and potential gap fill; sustained breach could target 200-day MA extensions, hinting at broader sector recession fears amid high funding costs.
- Support near 50.00: Psychological round number overlapping pivot point (50.32); interim floor if minor recovery unfolds.

Resistance overhead challenges any counter-trend rallies, rooted in MAs and pivot resistances.
- Resistance near 50.30 (Pivot/R1 approach): Central pivot (50.32) and 10-day MA zone; a push above might relieve immediate pressure, targeting R1 at 51.85 and signaling bullish pivot.
- Resistance at 51.85 (R1): Classic R1 level and 20-day MA (51.11) convergence; penetration could draw dip-buyers, but rejection reinforces downtrend.
- Resistance around 53.35 (R2): Multi-week high extension and 60-day MA (53.27); overcoming this might indicate rotation back into cyclicals.
- Resistance near 54.90 (R3): Upper pivot and prior swing high; decisive break eyes 52-week territory, potentially on strong earnings beats.
A break above R1 (51.85) could signal momentum reversal toward uptrend tests, whereas support failures below S1 (48.80) might prompt trailing stops lower, educating traders on multi-pivot confirmation.
Indicators – RSI, MACD, Volume
RSI (14-period) on XLF’s daily chart flashes deeply oversold at 29.38 in March 2026, dipping into buy territory below 30 alongside Stochastic Oscillator (5.62%) and Stochastic RSI (14.11), suggesting exhaustion selling and potential snap-back rallies. However, in strong downtrends, oversold readings can persist, so traders pair them with price action for divergences rather than early entries—neutral overall until 50 centerline reclaim.
MACD (12,26,9) confirms bearish momentum at -1.00, with the histogram contracting negatively and signal line below zero, indicating fading downside velocity but no bullish crossover yet; Awesome Oscillator (-2.45) and Momentum (-2.54) add sell pressure. Watch for histogram upticks near supports as early clues to bullish shifts, common in sector ETFs post-oversold.

Volume spikes prominently on down days—evident in the March selloff from 53.00—while rallies see drying participation, highlighting seller dominance; recent sessions near 71 million shares on declines (e.g., March 9 at $50.33 drop) versus subdued upside volume underscores caution. Elevated volume on support tests could signal capitulation, a key watch for reversal hunters.
Short-Term Outlook for XLF in March 2026
XLF’s technical setup screams caution in March 2026, with downtrend intact, all major MAs in sell mode, and MACD bearish, though clusters of oversold oscillators (RSI 29, Stoch 5-14) near S1 support (48.80) offer bounce prospects if bank earnings surprise positively. Pivot battles around 50.32 will dictate near-term bias, balanced against macro headwinds like persistent inflation or regulatory scrutiny on big banks.
Retail traders might favor range-bound tactics or defined-risk plays, using levels for reference amid volatility.
What traders are watching:
- S1 (48.80) defense on upcoming bank earnings (JPM, GS, etc.) for oversold bounce confirmation.
- Volume pickup above 50.30 pivot amid Fed minutes or rate cut odds.
- RSI divergence from new lows, paired with Stochastic buy signals.
- Sector rotation versus XLE (energy) or XLV (healthcare) on relative strength charts.
- NIM trends from Q1 reports, plus 10-year Treasury yield spikes impacting financials.
Risks and Important Notes
Even well-defined technical levels in XLF can shatter on surprises like abrupt Fed hikes, geopolitical flare-ups, or litigation hits to major holdings, amplified by the sector’s beta to economic data. Low-volume breaks often fake out, while news gaps bypass pivots entirely—always prioritize risk management over pattern chasing.
This piece is purely educational, not financial advice; conduct your own research, factor in fundamentals like dividend yields, and align strategies with personal risk tolerance in leveraged sector plays.
Dive into related coverage on fellow sector ETFs like XLE (Energy Select), XLI (Industrials), or broad-market SPY for rotation context, plus small-cap financial peers via IWM financial components.