XLF Technical Analysis: Trend, Levels & Outlook March 2026
Financial Select Sector SPDR Fund (XLF) is one of the most widely traded sector ETFs, representing the financial sector of the S&P 500. It includes major banks, insurance companies, asset managers, and financial service providers. Because of its composition, XLF is highly sensitive to interest rates, economic growth expectations, and monetary policy decisions.
In March 2026, XLF is drawing increased attention as financial markets react to central bank policies, inflation trends, and economic data. The performance of large institutions such as banks and investment firms plays a major role in shaping the ETF’s direction. Traders closely monitor XLF as it often acts as a leading indicator of economic strength or weakness. This article provides a detailed breakdown of XLF’s current price trend, key support and resistance levels, and important technical indicators.
Current Price Trend in March 2026
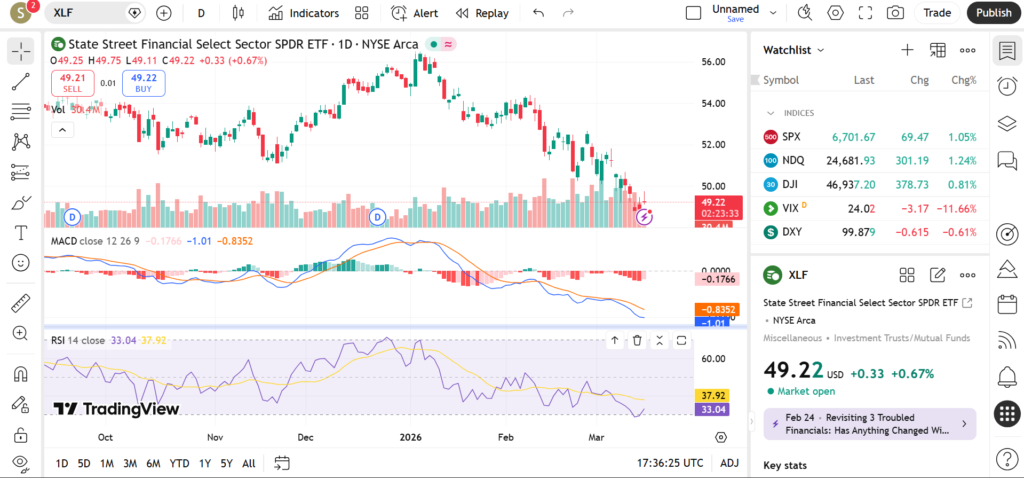
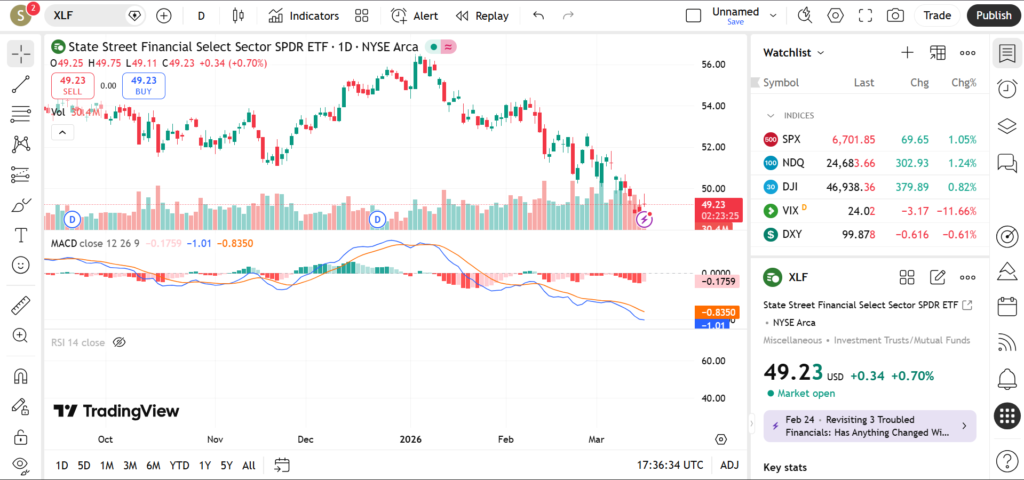
XLF has shown a structured but somewhat cautious trend during March 2026. The ETF has been moving within a controlled range, with periods of upward movement followed by consolidation. This suggests that while bullish sentiment exists, it is not yet strong enough to create a sustained breakout.
The 20-day moving average is currently acting as a short-term guide for price action. When XLF trades above this level, it often indicates short-term bullish momentum driven by positive financial sector sentiment. However, frequent tests of this level suggest that traders are still uncertain about the near-term direction.
The 50-day moving average serves as a key medium-term support level. During recent pullbacks, XLF has shown attempts to stabilize around this zone, indicating that buyers are stepping in at these levels. This makes the 50-day moving average a critical level for maintaining the current trend.
The 200-day moving average remains one of the most important indicators for long-term investors. XLF trading above this level suggests that the broader financial sector remains in a relatively stable condition. A breakdown below this level could signal deeper concerns about economic growth or financial stability.
Key Support and Resistance Levels
Support levels for XLF are clearly defined due to its structured price movement. The first major support lies near recent swing lows, where the ETF previously found buying interest after short-term declines. These levels often act as the first line of defense for bulls.
Another important support zone is located near the 50-day moving average. This dynamic level often acts as a strong support during trending markets and provides insight into whether the medium-term trend remains intact.
A deeper support level can be found near the 200-day moving average. If price approaches this area, it may indicate broader market weakness or a shift in investor sentiment toward the financial sector.
On the resistance side, the first major level lies near recent swing highs where price previously struggled to move higher. This level represents an area of selling pressure.
The next resistance zone lies near previous breakout attempts that failed to sustain momentum. These levels are important because they often determine whether the ETF can transition into a stronger bullish phase.
A higher resistance level exists near multi-month highs. A breakout above this level could signal a strong bullish continuation, potentially driven by improving economic conditions or favorable monetary policy.
Indicators – RSI, MACD, Volume
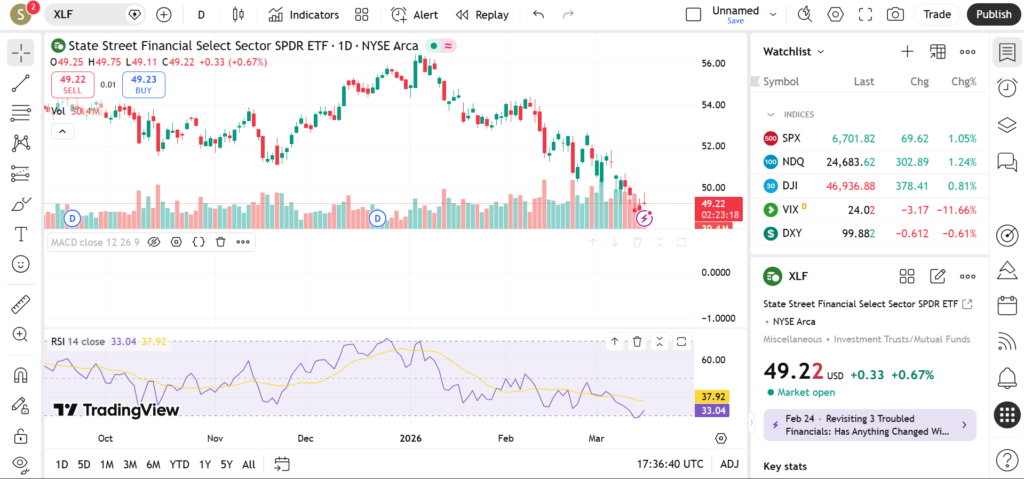
The Relative Strength Index (RSI) for XLF currently sits in the neutral range, indicating balanced momentum. This suggests that the ETF is neither overbought nor oversold, leaving room for movement in either direction depending on market catalysts.
MACD signals show periods of mild bullish momentum, with occasional crossovers indicating upward pressure. However, the lack of strong divergence suggests that momentum is not yet strong enough to confirm a major trend shift.
Volume patterns provide additional insight. Increased volume during upward movements suggests accumulation by institutional investors, while declining volume during pullbacks indicates a lack of strong selling pressure. This combination often supports a gradual upward trend.
Short-Term Outlook for XLF in March 2026
The short-term outlook for XLF remains cautiously bullish, but heavily dependent on macroeconomic factors. If interest rates stabilize or decline, financial stocks may benefit, potentially pushing XLF higher.
However, uncertainty around inflation and economic growth could limit upside potential and keep the ETF within a range.
What traders are watching
• Interest rate decisions and central bank policies
• Bank earnings and financial sector performance
• Breakouts above resistance levels
• Reactions near the 50-day moving average
• Overall market sentiment toward risk assets
Risks and Important Notes
The financial sector is highly sensitive to macroeconomic changes. Unexpected shifts in interest rates or economic data can lead to rapid price movements.
Additionally, regulatory changes or global financial instability can impact the sector.
This analysis is for educational purposes only and not financial advice.
For further insights, traders may explore other sector ETFs or broader market indices.