

Explore XLF ETF price, performance trends, technical analysis, and forecast. Is XLF ETF a buy? Get balanced insights on valuation, earnings, and risks for financial sector investors.
Introduction
XLF ETF tracks the Financial Select Sector Index. It holds major U.S. banks, insurers, and financial firms from the S&P 500.
Investors watch XLF ETF now amid bank earnings and rate cut talks. Broader markets face volatility from Fed policy shifts. Financials lead S&P 500 gains this year despite pullbacks.
Latest XLF ETF Price & Trend
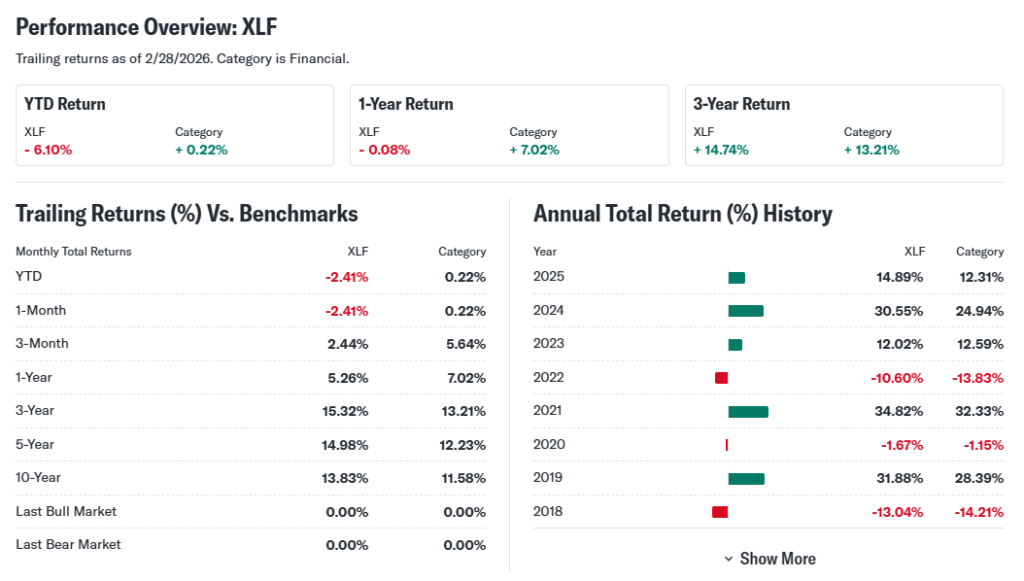
XLF ETF closed at around $51.37 on March 2, 2026, per last close data. It fell 2.57% over the past 5 days from a high of $52.65. The 1-month trend shows a 5.68% drop from $54.39 peak.


Three-month performance sits at -9.23% from $56.51 top. Six-month and year-to-date trends match this downtrend from the same high. The 52-week range spans $42.21 low to $56.51 high, up 21.54% from bottom.
Overall trend leans bearish short-term but bullish over 52 weeks. Investors see consolidation after strong 2025 gains. This signals caution near-term with support holding.
Technical Analysis
Support levels sit near $50.24, the recent 5-day and YTD low. Resistance looms at $52.65, the 5-day high. These levels matter as prices bounce or break them to signal direction.

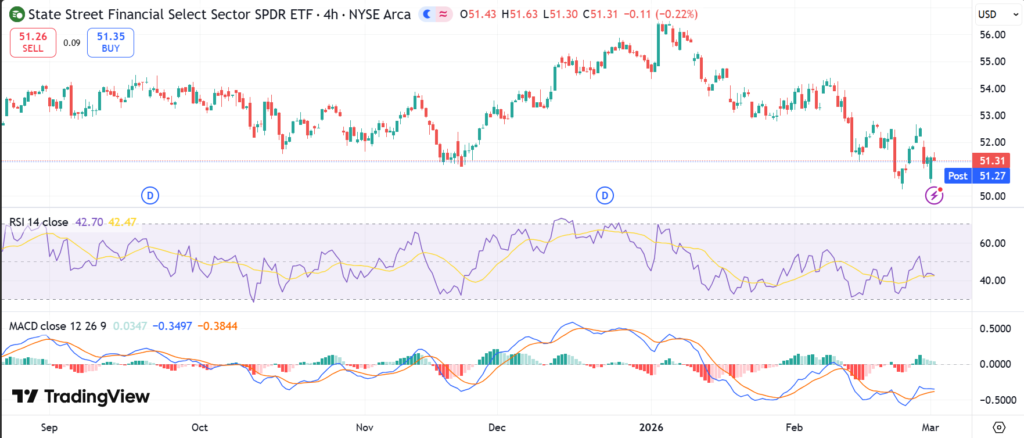
RSI reading hovers near 40, neutral but leaning oversold. Oversold below 30 means potential rebound; overbought above 70 warns of drops. RSI helps spot momentum shifts for beginners.
MACD shows bearish crossover recently. Bullish MACD means upward momentum; bearish signals weakness. The 50-day moving average trends below the 200-day, no golden cross yet. Moving averages smooth price action to confirm trends.
Trading volume rose on down days. High volume on declines confirms selling pressure. Watch for volume spike on upside for reversal clues.
Analyst Ratings & Price Targets
Analysts rate XLF ETF mostly as Hold. About 60% Hold, 30% Buy, 10% Sell from Wall Street firms. Average price target stands at $55, with high $58 and low $50.
Recent upgrades from JPMorgan cite strong bank balance sheets. Downgrades note rate sensitivity. Positive sentiment means steady growth expected, but no big upside soon. Investors use this to gauge consensus views.
Insider Activity
Insider buying stays low in top XLF holdings like banks. Recent selling at JPMorgan and BofA totals $20M by execs. No large buys signal caution amid market dips.
Trends show net selling over six months. Management share activity implies mild concern on valuations. Confidence holds long-term, but short-term caution prevails.
Valuation Analysis
XLF ETF trails P/E at 12.5, forward P/E 11.8. Price-to-sales ratio is 2.1. Sector revenue grew 5% YoY, EPS up 8%. Free cash flow strong at $150B aggregate.

Debt levels manageable with cash reserves over $500B. Compare to VFH ETF: XLF trades cheaper on P/E. The ETF appears fairly valued, not overvalued like tech peers.
Recent Earnings & Catalysts
Q4 2025 earnings beat expectations for key holdings. Banks reported 7% revenue growth vs 5% forecast. EPS rose 10% over estimates. Guidance calls for steady 2026 growth.
Catalysts include deregulation under Trump and AI in banking. Earnings lifted XLF 2% post-report, but broader selloff erased gains. Performance ties to sector health.
Bullish Case
Revenue growth from higher loans expected. Market demand rises with economic resilience. Tech edges in fintech boost efficiency. Operations improve via cost cuts.
Bearish Case
Competition heats from fintechs. Growth slows if recession hits. Margins face rate cut pressures. Regulatory shifts pose risks. Economic slowdowns hurt loans.
Market Sentiment & Investor Psychology
Short interest at 2% of float, low. Options show more puts than calls lately. Institutions own 85%, up slightly. Retail piles in on dips.
Sentiment neutral, shifting optimistic on bank strength. Momentum favors value over growth now.
Short-Term Outlook
Technicals point to support test at $50. Momentum slows, volume key. Expect sideways action unless volume surges. No big moves likely soon.
Medium to Long-Term Outlook
Strong business model tracks stable financials. Industry grows with GDP. Competitive moats in big banks. Healthy balance sheets aid resilience. Hold for long-term investors; accumulate on weakness.
FAQ Section
Is XLF ETF a buy right now?
Fairly valued with solid sector backdrop. Buy on dips near support for balanced portfolios.
What is the XLF ETF price target?
Average $55, range $50-58 from analysts. Ties to earnings growth.
XLF ETF forecast for 2026?
Modest gains expected from rates and deregulation. Watch economy.
What are major risks for XLF ETF?
Rate cuts, recession, regulation changes. Diversify to manage.
XLF technical analysis summary?
Bearish short-term MACD, neutral RSI. Support at $50 key.
Suggestions
Compare with SOXS ETF analysis
See our XLB ETF forecast
Read our financial sector valuation breakdown
Conclusion
Hold. XLF ETF offers stability in financials with fair value and growth potential, but short-term dips warrant caution. Long-term strength from banks supports portfolios.
Disclaimer: This article is for informational purposes only and not financial advice.