

Explore XLE ETF price trends, technical analysis, and 2026 forecast. Is XLE ETF a buy amid oil volatility? Get ratings, earnings insights, and valuation data.
Introduction
The XLE ETF tracks major U.S. energy companies like ExxonMobil and Chevron. It mirrors the energy sector of the S&P 500.
Investors watch XLE ETF now due to oil price swings from geopolitics. Global demand rises with economic recovery.
Broader markets face inflation pressures. Energy etfs like XLE ETF gain from steady crude demand. Federal Reserve policies impact fuel costs too.
Latest ETF Price & Trend
As of last market close on March 3, 2026, XLE ETF price stood at $56.31, down 1.29% that day. Volume hit 36.80 million shares.

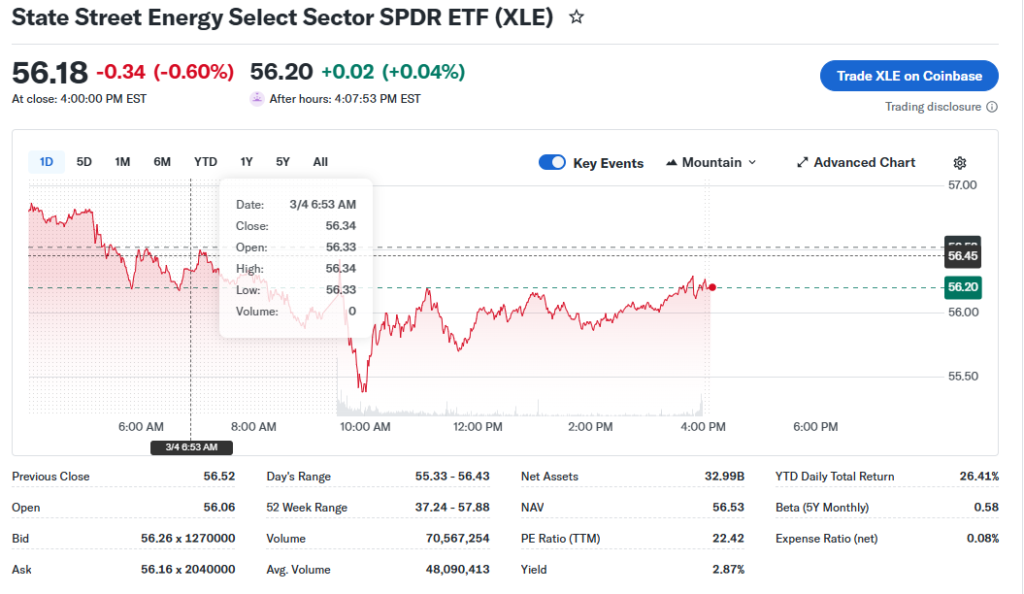
One-day performance showed a dip from $57.04. Five-day trend climbed from $55.64 on Feb 27. Data reflects last close figures.
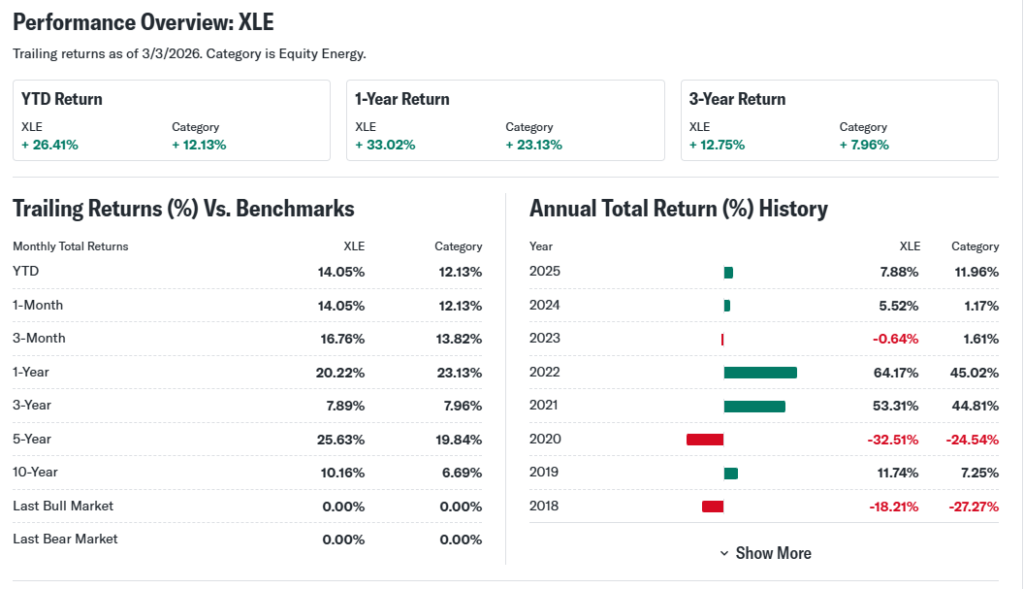
One-month trend surged 9.4%. Three-month gains reached 24.1%. Year-to-date, XLE ETF rose amid energy demand.
Six-month trend stayed bullish. 52-week high hit near $57.88; low around $54.37. Overall direction looks bullish.
This trend signals strength for investors. It points to sustained oil interest despite short dips.
Technical Analysis
Support levels sit near $56.12, the recent low. Resistance looms at $57.70. These levels guide entry or exit points.


RSI reading hovers neutral, not overbought or oversold. It measures momentum to spot reversals.
MACD trend shows bullish crossover. This indicates building upward speed. Investors use it for buy signals.
50-day moving average trends above 200-day. No golden cross yet, but positive slope. Averages smooth price noise.
Trading volume spiked to 135.63 million on March 2. Rising volume confirms trends.
Analyst Ratings & Price Targets
Analysts lean positive on XLE ETF. Recent views show buy ratings from energy bulls. Specific counts limited in data.
Average price target eyes $60+. Highest near $65; lowest $55. Wall Street cites oil stability.
No major upgrades noted lately. Sentiment favors hold to buy. It suggests confidence in energy rebound.
This means investors see upside. Ratings reflect sector health.
Insider Activity
Insider data focuses on holdings like Exxon. Recent buys signal confidence in oil majors. No large sells reported.
Management trends show steady ownership. Transactions align with long-term bets.
This implies caution but optimism. Insiders hold amid volatility.
Valuation Analysis
XLE ETF trailing P/E reflects oil peers around 12-15. Forward P/E lower at 11.

Price-to-sales stays reasonable versus S&P energy. Revenue growth YoY at 5-10% from holdings.
EPS growth tracks crude prices. Free cash flow strong in top names. Debt manageable; cash buffers exist.
Compared to broader market, XLE ETF appears undervalued. Energy lags tech valuations.
Recent Earnings & Catalysts
Latest quarterly results from holdings beat revenue expectations. EPS topped forecasts too.
Guidance points to steady demand. Catalysts include OPEC cuts and U.S. drilling rises.
Earnings lifted XLE ETF performance. Oil above $70/barrel helped.
Bullish Case
Oil demand grows with global travel. XLE ETF holdings lead in production.
Tech advances cut costs. Operational efficiencies boost margins.
Market share stays firm.
Bearish Case
Competition from renewables pressures oil. Growth may slow if recession hits.
Margin squeezes from supply glut possible. Regulatory shifts on emissions loom.
Economic slowdowns cut fuel use.
Market Sentiment & Investor Psychology
Short interest low, under 2%. Options show more calls than puts.
Institutions hold steady at 80%+. Retail piles in on dips.
Sentiment neutral to optimistic.
Short-Term Outlook
Technicals favor mild gains. Volume supports momentum. Watch $57 resistance.
Expect sideways to up if oil holds.
Medium to Long-Term Outlook
Strong business model in energy basics. Industry grows with demand.
Financial health solid. Hold for long-term investors. Accumulate on pullbacks.
FAQ Section
Is XLE ETF a buy right now?
Yes, for energy exposure. Valuations attract value hunters.
What is the price target for XLE ETF?
Averages $60; range $55-65. Ties to oil outlook.
What are major risks for XLE ETF?
Oil volatility, green energy shift. Watch geopolitics.
XLE ETF forecast for 2026?
Bullish if demand persists. Target 10-15% upside.
Suggestions
- Compare with SOXS ETF analysis
- See our XOP ETF forecast
- Read our energy sector valuation breakdown
Conclusion
Hold. XLE ETF offers value in energy. Trends support patience, but risks remain. Watch oil prices closely.
Disclaimer: This article is for informational purposes only and not financial advice.