
Explore UNG ETF price trends, technical analysis, and 2026 forecast. Is UNG ETF a buy amid rising natural gas demand? Get expert insights on valuation and risks.
Introduction
Natural gas prices swing with weather and supply.
The UNG ETF tracks near-month futures contracts on NYMEX.
Investors watch UNG ETF now due to cold winters boosting demand.
Broader energy markets face volatility from global LNG exports.
Latest ETF Price & Trend
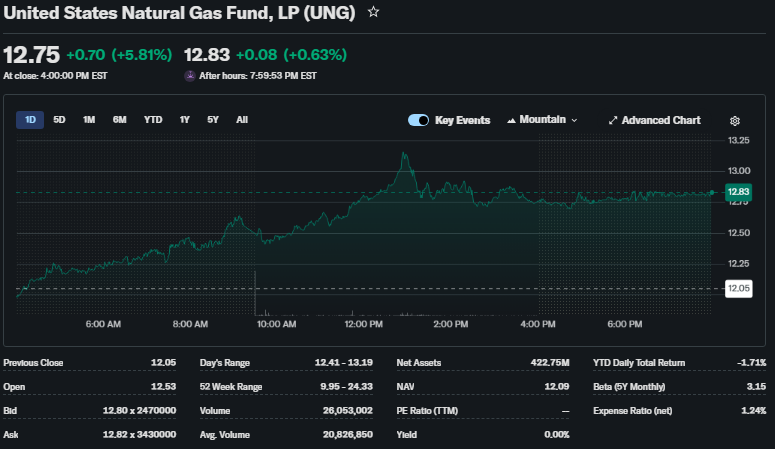
As of last market close on March 6, 2026, UNG ETF traded at $13.19, down sharply.
It fell 3.34% in one day amid profit-taking.
Over five days, it dropped amid mild weather forecasts.
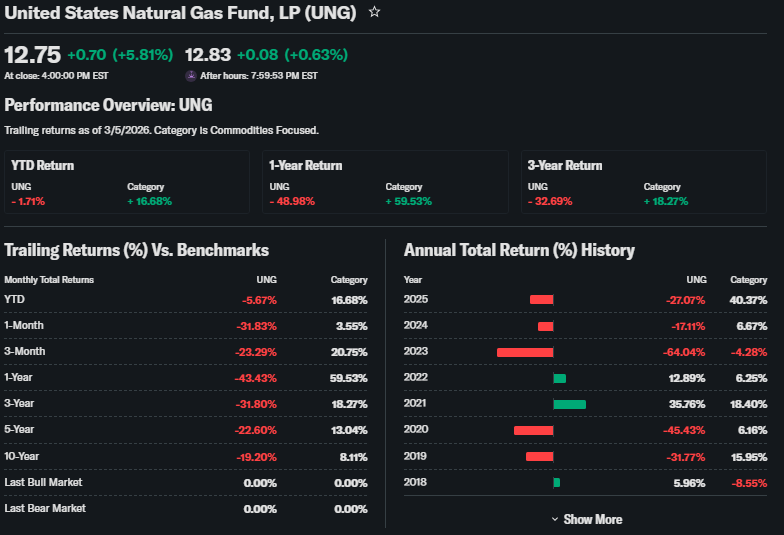
The one-month trend shows a 6.22% decline from $13.27 on February 6.

Three-month performance plunged 23.98% from December levels.
Six-month returns weakened as summer injections rose.
Year-to-date, UNG ETF gained 1.71% despite recent pullbacks.
52-week high hit $24.33 in March 2025; low was $9.95 in January 2026.
Overall trend leans bearish short-term but with bullish reversal signs from lows.
This signals caution for traders, yet value for long-term energy bulls.
Technical Analysis
Support levels sit at $13.62 (S3) and $13.73 (S2), key floors if selling persists.
Resistance looms at $14.00 (R1) and $14.17 (R3), potential upside targets.
RSI reading hovers near 40, neutral but not oversold; below 30 signals buy chances.
MACD shows bearish crossover, hinting momentum favors sellers short-term.

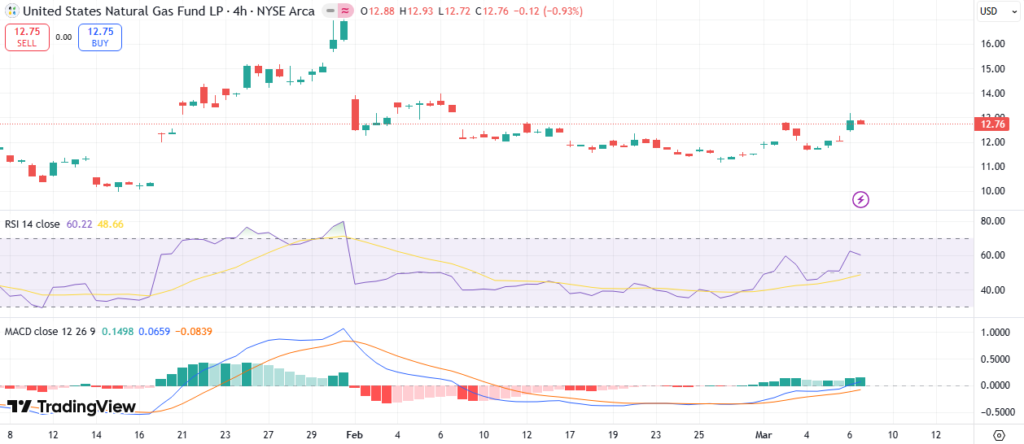
50-day moving average at $14.50 pressures price from above.
200-day average near $16.00 confirms downtrend since peaks.
No golden cross (50-day over 200-day); death cross lingers from late 2025.
Trading volume spiked to 16 million shares recently, showing high interest.
These indicators warn of volatility; watch volume for breakout clues.
Analyst Ratings & Price Targets
Few traditional Buy/Hold/Sell ratings exist for commodity ETFs like UNG ETF.
Average price target around $15-18 from energy desks, high at $20, low $12.
No major upgrades lately; Barclays noted seasonal demand in February notes.
Wall Street leans Hold amid storage data swings.
This mixed sentiment urges diversified positions over aggressive bets.
Insider Activity
UNG ETF lacks traditional insiders as a fund.
No recent buying or selling from management reported in SEC filings.
USCF Investments, the sponsor, holds steady oversight without large trades.
Activity trends show no shifts, implying neutral confidence.
Stable ownership reduces red flags for investors.
Valuation Analysis
Commodity ETFs like UNG ETF skip P/E ratios; focus on futures premium.
No trailing or forward P/E applies directly.
Price-to-nav hovers near 1.0, fairly tracking gas futures.
Natural gas revenue tied to Henry Hub spot at $2.80/MMBtu recently.

YoY gas production growth slowed to 2%; EPS irrelevant for funds.
Free cash flow not applicable; focus on contango/roll costs eroding returns.
Low debt in structure; cash from creation units solid.
Versus peers like BOIL, UNG appears fairly valued, not overpriced.
Neutral stance: neither undervalued nor premium-laden.
Recent Earnings & Catalysts
ETFs report no quarterly earnings; track EIA storage weekly.
Latest data: builds exceeded expectations, pressuring prices.
No EPS beats; guidance via futures curve shows summer dip.
Catalysts include winter storms, LNG export ramps to Europe.
Storage gluts hurt recent UNG ETF performance by 6% post-report.
Bullish Case
Rising global LNG demand from Asia fuels exports.
Winter heating needs spike U.S. consumption 30% seasonally.
Supply constraints from reduced drilling lift spot prices.
Operational efficiencies in pipelines cut bottlenecks.
Steady demand growth supports UNG ETF recovery.
Bearish Case
Mild weather cuts heating demand sharply.
Oversupply from shale keeps prices under $3.
Competition from renewables pressures long-term gas.
Margin squeezes via futures contango erode ETF gains.
Regulatory carbon taxes loom as risks.
Market Sentiment & Investor Psychology
Short interest low at under 5% of float.
Options skew to puts, reflecting caution on volatility.
Institutions hold 20%+; inflows rose in January lows.
Retail piles in on weather plays, momentum-driven.
Sentiment neutral, tilting optimistic on seasonal rebound.
Short-Term Outlook
Technicals point to support test at $13.60.
Momentum fades with low volume; EIA data key Wednesday.
Volume uptick could push to $14 resistance.
Expect sideways grind unless weather shifts.
Medium to Long-Term Outlook
Fund model strong for gas beta plays.
Industry grows 3-5% yearly on LNG.
Competitive edge in liquid futures tracking.
Financials healthy; risks from green energy shift.
Long-term investors should watch for accumulation below $12.
FAQ Section
Is UNG ETF a buy right now?
Neutral; buy dips under $13 if bullish on winter gas demand.
What is the price target for UNG ETF?
Analysts eye $15-20 average by year-end 2026.
What are major risks for UNG ETF?
Weather misses, storage builds, contango decay.
UNG ETF forecast for 2026?
Modest gains to $18 if exports rise; volatile otherwise.
What is UNG technical analysis summary?
Bearish MACD, neutral RSI; support at $13.60.
Suggestions
Compare with SOXS ETF analysis
See our natural gas futures forecast
Read our energy sector valuation breakdown
Conclusion
Hold or Watchlist. UNG ETF suits tactical trades on gas volatility, not core holdings. Balance weather-driven upside against supply risks. Trends favor patience over chasing.
Disclaimer: This article is for informational purposes only and not financial advice.