
TZA technical analysis March 2026 – small‑cap bear ETF support, resistance and outlook
Direxion Daily Small Cap Bear 3X Shares (TZA) is a leveraged inverse ETF that seeks to deliver 3x the opposite of the daily performance of the Russell 2000 Index, which tracks U.S. small‑cap stocks. Because it is triple‑leveraged and inverse, TZA is highly volatile and primarily aimed at sophisticated traders looking for short‑term bearish exposure to small caps rather than long‑term investors.
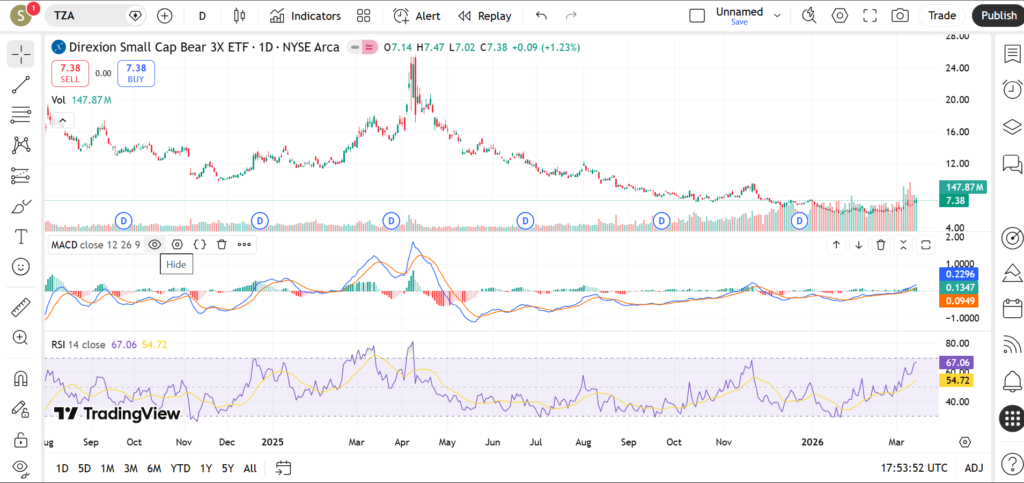
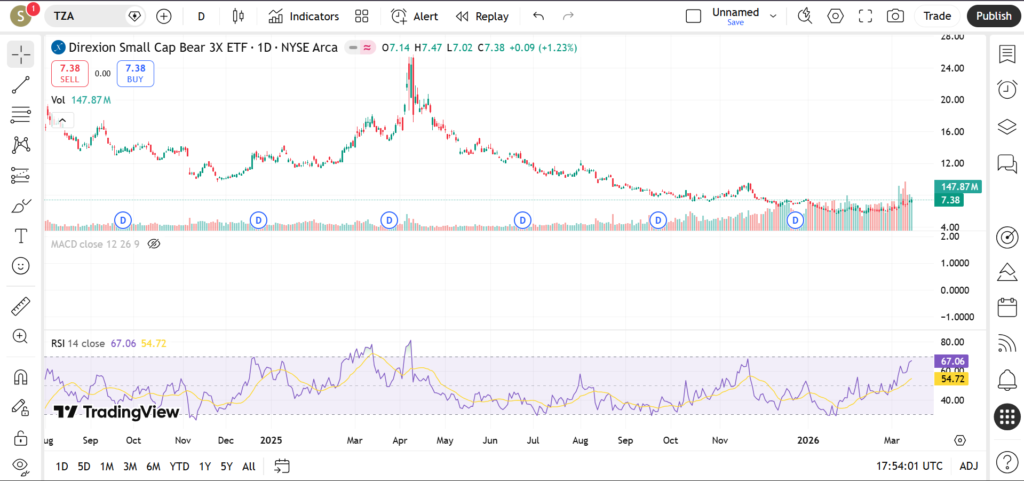
As of mid‑March 2026, TZA is trading in the high single‑digits, having moved within an intraday range just above 7 recently and sitting significantly below its 52‑week high, which underscores the strength of small‑cap rallies over the past year. This article explores TZA’s current price trend, key support and resistance areas, RSI/MACD/volume signals and short‑term outlook so traders can better understand how to use it tactically during periods of small‑cap stress.
Current Price Trend in March 2026
TZA’s current level around the mid‑7s in mid‑March reflects a market where small‑caps have generally strengthened, pushing inverse leveraged products like TZA lower over the longer term. Over the last 52 weeks, TZA has traded within a broad band that includes a much higher 52‑week high and a low closer to its recent prices, indicating that small‑cap weakness has been more intermittent than persistent.
Shorter‑term, the ETF’s day range around 7.02–7.47 and recent close near 7.38 show that it remains very responsive to even modest Russell 2000 swings. On many charts, this appears as a series of lower highs and potentially flattening lows, which together may suggest a maturing downtrend or the early stages of a base, depending on how small‑caps behave in coming weeks. Because TZA is 3x levered, even small reversals in the Russell 2000 can translate into noticeable movements on the TZA chart.
In relation to moving averages, TZA is likely trading below its 200‑day moving average, reflecting the broader uptrend in small‑cap equities. The 20‑ and 50‑day averages may be closer to current price; in periods when the Russell 2000 consolidates or pulls back slightly, TZA can briefly reclaim one or both of these shorter‑term averages before rolling over again if small‑caps resume their climb. For many traders, regaining the 50‑day average and holding above it is a first sign that downside momentum in small caps is gaining traction.
Key Support and Resistance Levels
Given TZA’s 3x inverse structure, support and resistance levels should be treated as zones rather than exact ticks, and traders should allow for wider intraday noise.
Key support levels
- Recent day‑range low around 7.00
The lower bound of the recent trading range, just above 7.00, is the first obvious support level. A clean break and consolidation below this area would suggest that small‑cap strength is intensifying and that demand for bearish small‑cap exposure is fading. - 52‑week low vicinity
TZA is closer to its 52‑week low than its high, which implies that nearby multi‑month lows form a deeper support zone. If price retests that region and shows long lower wicks and rising volume, traders may interpret it as a sign of capitulation in bearish positioning; a decisive breakdown would indicate further small‑cap resilience. - Psychological level at 5 (medium‑term reference)
While not necessarily tested recently, the round 5 level would be watched as a major psychological threshold if TZA continued to decline over coming months. Round numbers in leveraged ETFs often become focal points for sentiment shifts and volatility spikes.
Key resistance levels
- Recent close and intraday highs near 7.4–7.5
The top of the recent day range around 7.47, together with the latest close around 7.38, marks a nearby resistance band where rallies have paused. A break above this zone could indicate that small‑caps are entering a short‑term corrective phase, potentially pushing TZA toward its short‑term moving averages. - Short‑term moving averages (20‑ and 50‑day)
If these averages sit above current price, they may function as dynamic resistance levels; repeated failures to hold above them can confirm that the larger trend still favours small‑cap strength. Conversely, a decisive regain of both the 20‑ and 50‑day averages, accompanied by strong volume, may signal that TZA is transitioning from a grind lower into a more active up‑move. - Intermediate resistance toward prior swing highs
Any recent swing highs set during past small‑cap pullbacks form additional resistance levels on the chart. Should TZA rally back into those zones, traders may watch closely for either rejection (implying the small‑cap pullback is ending) or breakout (implying a deeper small‑cap correction).
Because of the ETF’s leverage, stops and profit targets around these levels are often placed with a margin of error to account for rapid intraday spikes.
Indicators – RSI, MACD, Volume
RSI on TZA has likely spent extended periods below the 50 line, consistent with the prevailing strength in small‑cap stocks over the last year. When small‑caps rally strongly, TZA tends to drift lower and RSI can approach or dip into oversold territory, signalling a stretched upside move in the Russell 2000. When small‑caps stumble and TZA spikes, RSI can snap higher toward or above 70, pointing to short‑term overextension in bearish sentiment.
MACD helps visualize whether the momentum in bearish small‑cap positioning is increasing or fading. During periods of sustained small‑cap uptrends, MACD on TZA will typically remain below zero with only modest bullish crossovers that do not persist. More serious corrections in small‑caps show up as MACD turning up, crossing the signal line and accelerating toward or above the zero line, especially when this is accompanied by higher prices and expanding volume in TZA.

Volume in TZA tends to increase during risk‑off episodes that disproportionately affect small‑cap stocks, such as growth scares, liquidity concerns or sector‑specific shocks. Recent trading shows a healthy level of activity, with intraday ranges reflecting strong interest whenever the Russell 2000 experiences volatility. Traders often look for volume spikes during TZA rallies as confirmation that the move is driven by genuine hedging and speculative flows rather than thin‑market noise.
Short‑Term Outlook for TZA in March 2026
Overall, TZA’s technical profile in March 2026 points to an instrument that remains in a larger downtrend but retains the capacity for sharp, tradable spikes during bouts of small‑cap weakness. With price closer to its 52‑week low, small‑cap bulls have the upper hand in the longer‑term battle, but the presence of leverage and inverse exposure means that short‑term traders can still find opportunities on downside swings in the Russell 2000.
From a tactical standpoint, traders may treat TZA as a tool for short‑duration trades around macro events, earnings seasons and periods of rising volatility. The key is to pay close attention to how price behaves around nearby support near 7 and resistance in the mid‑7s and at the short‑term moving averages, while also tracking whether RSI and MACD confirm or contradict price action.
What traders are watching
- The 7.00 support zone and whether it continues to hold on dips or gives way in favour of further small‑cap strength.
- Breaks above recent intraday highs around 7.4–7.5 and any subsequent follow‑through toward short‑term moving averages.
- Shifts in small‑cap sentiment driven by economic data, rate‑cut expectations, and sector‑specific news that disproportionately impact smaller companies.
- RSI and MACD signals that may highlight turning points, especially when they coincide with high‑volume sessions.
- How TZA reacts during risk‑off episodes compared with other inverse and volatility products, to gauge whether small‑caps are leading or lagging broader market stress.
Risks and Important Notes
TZA’s triple‑leveraged inverse structure introduces significant risks beyond those of standard ETFs. Daily rebalancing and compounding can cause performance over holding periods longer than a day to diverge materially from simply “three times the inverse” of the Russell 2000’s cumulative move. Unexpected macro shocks, liquidity squeezes or sharp reversals in small‑caps can lead to large intraday swings and gaps that blow through technical levels.
Because of this, TZA is generally considered a short‑term tactical vehicle rather than an instrument for long‑term hedging or directional bets. Traders should be especially cautious with position sizing, holding periods and leverage stacking (for example, using margin on top of a 3x ETF). As always, the analysis here is intended to be educational; it is not personalized advice, and individual circumstances, objectives and constraints need to be assessed independently.
For traders interested in TZA, it can be useful to also follow technical analysis on unleveraged small‑cap ETFs (such as IWM) and related leveraged bull products (like TNA). Comparing these instruments can help illuminate the interplay between bullish and bearish small‑cap positioning across different volatility regimes.
Suggested chart image placements for TZA article
- After the introduction
- Daily TZA chart showing the past 12 months, with 20‑, 50‑ and 200‑day moving averages and markers for the 52‑week high and current level near the 52‑week low.
- Inside the “Key Support and Resistance Levels” section
- Zoomed‑in daily chart for the last 3 months, highlighting the 7.00 support area, recent highs near 7.4–7.5, and any visible short‑term moving averages acting as resistance.
- Inside the “Indicators – RSI, MACD, Volume” section
- Multi‑panel chart displaying TZA price, RSI and MACD, plus a volume histogram that emphasizes spikes during recent small‑cap pullbacks.
Tags: TZA technical analysis, TZA March 2026, Direxion Daily Small Cap Bear 3X Shares, TZA support and resistance, TZA outlook, TZA price trend, TZA RSI MACD, leveraged small cap bear ETF, Russell 2000 inverse ETF, TZA chart analysis, TZA volatility, trading TZA in 2026, short term TZA forecast, TZA risk management, bearish small cap strategy
XLF – State Street Financial Select Sector SPDR ETF do for this tooo
XLF Technical Analysis March 2026
State Street Financial Select Sector SPDR ETF (XLF) Technical Analysis – Bearish Momentum Meets Key Supports
The State Street Financial Select Sector SPDR ETF (XLF) tracks the Financial Select Sector Index, providing targeted exposure to U.S. financial giants like banks, insurers, and asset managers, including heavyweights such as JPMorgan Chase, Berkshire Hathaway, and Goldman Sachs. In March 2026, traders are glued to XLF amid regulatory shifts under President Trump’s pro-business policies, volatile interest rates, and bank earnings season, as financials often lead or lag broader market rotations. This detailed analysis breaks down the short-term trend, critical support and resistance zones, RSI/MACD/volume signals, and actionable short-term outlook for retail traders seeking clarity in this high-beta sector ETF.
Financial sector ETFs like XLF amplify moves in rate-sensitive names, drawing scrutiny now with potential Fed pauses on cuts and fiscal stimulus debates influencing net interest margins (NIMs). As small-caps struggle and mega-banks report, XLF’s price action offers educational insights into sector rotation dynamics without dictating trades. We’ll explore moving average alignments, pivotal levels derived from recent swings, indicator readings, and scenarios traders might monitor.
Current Price Trend in March 2026
XLF is locked in a short-term downtrend during March 2026, characterized by lower highs and lower lows following a rejection from early-year peaks, with price trading well below key moving averages amid “strong sell” technical sentiment. Recent price action highlights a sharp multi-week decline from around the 53.00-54.00 zone—likely tied to hawkish Fed rhetoric and softer bank guidance—culminating in tests near 48.89 as of early March, underscoring bearish control.
The 20-day simple moving average sits at 51.11 (sell signal as price is below), the 50-day at approximately 52.50-53.00, and the 200-day near 52.82, all sloping downward and confirming bearish alignment; major swings include a February high near 53.94 (MA5 rejection) and a probe toward 48.00 lows. This configuration teaches retail traders about “death cross” risks when shorter MAs dip below longer ones, though oversold conditions hint at potential pauses rather than freefalls.
Volume has accompanied the downside, reinforcing the trend’s validity, while shallow bounces lack conviction— a classic sign of distribution in financial ETFs during uncertainty. Patient observation of MA fans (20/50/200 convergence) can signal if momentum exhausts near supports.
Key Support and Resistance Levels
Support levels for XLF in March 2026 cluster around pivot calculations, prior lows, and psychological floors, where institutional buying might emerge if sentiment stabilizes.
- Support near 48.80 (S1 pivot): Coincides with recent March lows around 48.89 and a minor swing low; a hold here could indicate short-term stabilization, while a break below might accelerate toward classic S2 at 47.29, signaling intensified bank sector weakness.
- Support at 47.30 (S2/Fibonacci): Aligns with deeper pivot S2 (47.29) and Fibonacci retracement from yearly highs; traders watch volume for absorption, as defense often precedes bounces in oversold financials.
- Support around 45.80 (S3): Classic triple pivot low and potential gap fill; sustained breach could target 200-day MA extensions, hinting at broader sector recession fears amid high funding costs.
- Support near 50.00: Psychological round number overlapping pivot point (50.32); interim floor if minor recovery unfolds.
Resistance overhead challenges any counter-trend rallies, rooted in MAs and pivot resistances.
- Resistance near 50.30 (Pivot/R1 approach): Central pivot (50.32) and 10-day MA zone; a push above might relieve immediate pressure, targeting R1 at 51.85 and signaling bullish pivot.
- Resistance at 51.85 (R1): Classic R1 level and 20-day MA (51.11) convergence; penetration could draw dip-buyers, but rejection reinforces downtrend.
- Resistance around 53.35 (R2): Multi-week high extension and 60-day MA (53.27); overcoming this might indicate rotation back into cyclicals.
- Resistance near 54.90 (R3): Upper pivot and prior swing high; decisive break eyes 52-week territory, potentially on strong earnings beats.
A break above R1 (51.85) could signal momentum reversal toward uptrend tests, whereas support failures below S1 (48.80) might prompt trailing stops lower, educating traders on multi-pivot confirmation.
Indicators – RSI, MACD, Volume
RSI (14-period) on XLF’s daily chart flashes deeply oversold at 29.38 in March 2026, dipping into buy territory below 30 alongside Stochastic Oscillator (5.62%) and Stochastic RSI (14.11), suggesting exhaustion selling and potential snap-back rallies. However, in strong downtrends, oversold readings can persist, so traders pair them with price action for divergences rather than early entries—neutral overall until 50 centerline reclaim.
MACD (12,26,9) confirms bearish momentum at -1.00, with the histogram contracting negatively and signal line below zero, indicating fading downside velocity but no bullish crossover yet; Awesome Oscillator (-2.45) and Momentum (-2.54) add sell pressure. Watch for histogram upticks near supports as early clues to bullish shifts, common in sector ETFs post-oversold.
Volume spikes prominently on down days—evident in the March selloff from 53.00—while rallies see drying participation, highlighting seller dominance; recent sessions near 71 million shares on declines (e.g., March 9 at $50.33 drop) versus subdued upside volume underscores caution. Elevated volume on support tests could signal capitulation, a key watch for reversal hunters.
Short-Term Outlook for XLF in March 2026
XLF’s technical setup screams caution in March 2026, with downtrend intact, all major MAs in sell mode, and MACD bearish, though clusters of oversold oscillators (RSI 29, Stoch 5-14) near S1 support (48.80) offer bounce prospects if bank earnings surprise positively. Pivot battles around 50.32 will dictate near-term bias, balanced against macro headwinds like persistent inflation or regulatory scrutiny on big banks.
Retail traders might favor range-bound tactics or defined-risk plays, using levels for reference amid volatility.
What traders are watching:
- S1 (48.80) defense on upcoming bank earnings (JPM, GS, etc.) for oversold bounce confirmation.
- Volume pickup above 50.30 pivot amid Fed minutes or rate cut odds.
- RSI divergence from new lows, paired with Stochastic buy signals.
- Sector rotation versus XLE (energy) or XLV (healthcare) on relative strength charts.
- NIM trends from Q1 reports, plus 10-year Treasury yield spikes impacting financials.
Risks and Important Notes
Even well-defined technical levels in XLF can shatter on surprises like abrupt Fed hikes, geopolitical flare-ups, or litigation hits to major holdings, amplified by the sector’s beta to economic data. Low-volume breaks often fake out, while news gaps bypass pivots entirely—always prioritize risk management over pattern chasing.
This piece is purely educational, not financial advice; conduct your own research, factor in fundamentals like dividend yields, and align strategies with personal risk tolerance in leveraged sector plays.
Dive into related coverage on fellow sector ETFs like XLE (Energy Select), XLI (Industrials), or broad-market SPY for rotation context, plus small-cap financial peers via IWM financial components.