
TZA Technical Analysis: March 2026 Uptrend Momentum & Key Levels
TZA is the Direxion Daily Small Cap Bear 3X Shares ETF, an inverse leveraged fund aiming for -3x the daily performance of the Russell 2000 Index, which tracks U.S. small-cap stocks across diverse sectors like industrials, financials, healthcare, and consumer goods. This positions it as a tactical short tool for betting against small-cap weakness, popular among traders seeking hedges during broad market rotations.
Traders monitor TZA in March 2026 as small caps face headwinds from high interest rates, slowing earnings growth, and risk-off sentiment amid geopolitical flares and Fed pause signals—despite recent bounces off lows around $7. This analysis details the trend, support/resistance, RSI/MACD/volume, and short-term view for informed retail trading.
Current Price Trend in March 2026
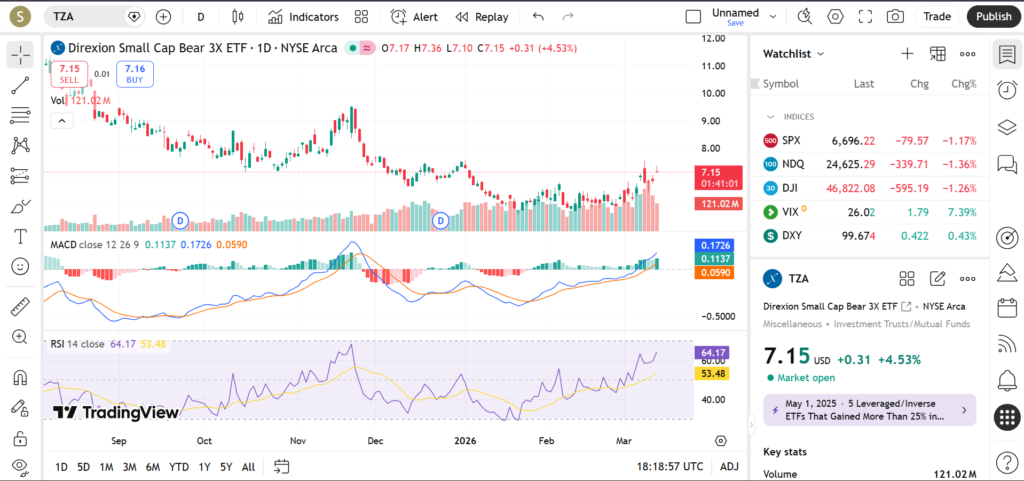
TZA exhibits a short-term uptrend in March 2026, rebounding from oversold lows near $6.68 on March 11, with price action pushing toward $7.14 highs amid higher lows formation on daily charts. Recent swings include a pivot bottom early March, followed by closes above the 10-day and 50-day MAs (near 7.56-8.41 range), signaling shift from prior downtrend.
The 20-day MA (~7.79) now supports pullbacks, while the 50-day (~8.41) caps minor rallies, with 200-day (~12.45) far overhead—educational for spotting leveraged inverse strength when Russell 2000 lags megacaps. This setup teaches watching MA crossovers for continuation in volatile bear ETFs.
Key Support and Resistance Levels
Supports offer potential stabilization for TZA’s up moves, tied to recent lows and stats.
- Primary Support at $6.65-$6.99 (1-day std dev lower / recent lows): March 11 volume cluster low, key for trend hold; break could retest $6.50 gaps from volatility spikes.
- Secondary Support near $6.84 (pivot / accumulated volume): Aligns with March 11 close and option interest, where buyers defended prior sessions.
- Tertiary Support around $6.50 (round / Bollinger lower): Psychological with band support, historical reversal zone in small-cap inverse plays.
Resistances test seller conviction.
- Primary Resistance at $7.30-$7.35 (1-day std dev upper / swing high): Recent March high with fading momentum; break signals stronger upside to 50-day.
- Secondary Resistance near $7.79-$8.00 (20-day MA / round): Short-term average confluence, profit zone if Russell softens further.
- Upper Resistance at $8.41 (50-day MA): Key trend benchmark; surpassing might target $9 quarterly pivots.
Traders note: above $7.35 could indicate multi-day rally on small-cap weakness, targeting secondaries; below $6.65 might signal exhaustion, prompting caution toward deeper supports.
Indicators – RSI, MACD, Volume
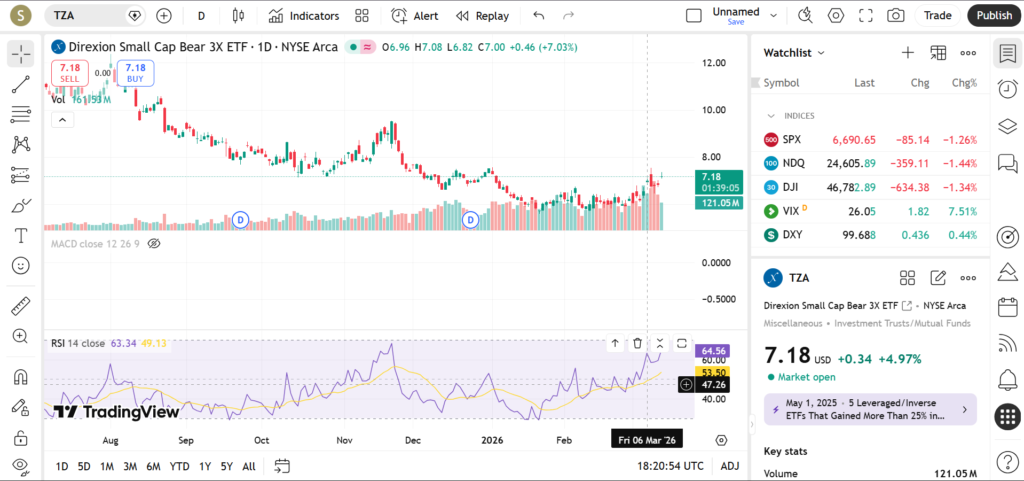
RSI (14) reads neutral around 40-46 on daily charts mid-March 2026, off oversold <20 earlier, suggesting balanced conditions without overbought risk (>70) for further gains. Stochastic ~16-20 reinforces mild oversold bounce potential on shorter frames.
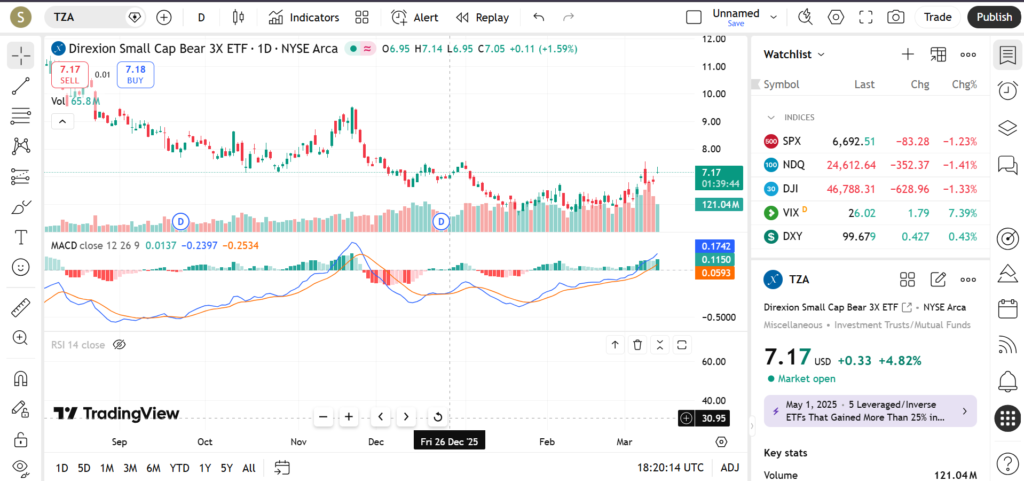
MACD (12,26) shows bullish crossover hints, with line above signal post-March pivot and histogram turning positive (~0.10 recent), though momentum may fade if small caps rally—watch for divergence.
Volume surges on up days (150M+ March 11, vs. avg 40-50M), confirming rallies with conviction, while pullbacks see lighter action—no big spikes yet signaling distribution in this inverse 3x vehicle.
Short-Term Outlook for TZA in March 2026
TZA’s technicals favor short-term upside in March 2026, backed by uptrend above rising MAs, neutral RSI, emerging MACD bull signal, and volume-backed advances—thriving as Russell 2000 underperforms amid macro caution. Key is defending $6.99 support for continuation toward $8 resistance cluster.
- What traders are watching:
- $7.35 resistance break on Russell 2000 weakness or CPI data showing persistent inflation.
- $6.65 support test amid small-cap earnings misses or Fed hawkishness.
- MACD histogram expansion; RSI climb to 60 as strength gauge.
- Russell rotation flows versus megacap dominance, geopolitical risk-off.
- Volume confirmation: spikes on ups for sustained move, dry-ups on downs for pauses.
Risks and Important Notes
Levels like $7.35 can fail on surprises such as small-cap earnings beats, rate cut hopes, or de-escalating global tensions flipping sentiment bullish for Russell—leveraging TZA’s -3x to swift reversals. High volatility (60%+) means gaps ignore technicals often.
Educational focus: monitor these for setups with defined risk; pair with position limits—analysis informs but news rules leveraged plays.
Compare TZA moves with TNA (bull counterpart) or SQQQ (Nasdaq bear). Read our TNA, SOXS technicals for inverse strategies, update this March 2026 page regularly.