TZA ETF forecast and analysis: explore TZA ETF price, technical analysis, risks, and whether Direxion Daily Small Cap Bear 3X ETF is a buy for bearish small-cap exposure.
Introduction
Direxion Daily Small Cap Bear 3X Shares (TZA) ETF is a leveraged fund designed to deliver three times the inverse daily performance of the Russell 2000 small-cap index. In simple terms, TZA tends to rise when U.S. small-cap stocks fall and decline when they rally. Investors are focused on this TZA ETF now because small caps remain sensitive to interest rates, credit conditions, and U.S. growth expectations, making bearish hedging tools more relevant. Broader market conditions have been choppy, with ongoing debates about the timing of Federal Reserve cuts and recession odds, which directly influence volatility in small-cap and inverse ETFs like TZA. For traders, the primary question is whether TZA ETF is an effective short-term hedge or a high-risk speculation at current levels.
TZA ETF is a complex product that resets daily, so its long-term performance can diverge significantly from the inverse of the Russell 2000 over time. That makes understanding TZA ETF price behavior, TZA ETF earnings proxies, and TZA forecast scenarios essential before committing capital.
Latest ETF Price & Trend
At the latest available close on Yahoo Finance, TZA ETF price was around 6.19 dollars, with the session opening near 6.39 dollars and trading in a 6.26–6.63 dollar range. This reflected heavy trading volume of over 84 million shares versus an average volume in the tens of millions, highlighting strong short-term interest in bearish small-cap exposure. Over the past 5 trading days, TZA has fluctuated in a relatively tight band around the mid-6 dollar level, suggesting consolidation after a prior downtrend. On a 1‑month basis, returns have been negative, and NAV-based performance over the last month has fallen more than 10 percent, signaling persistent pressure as small caps recovered.
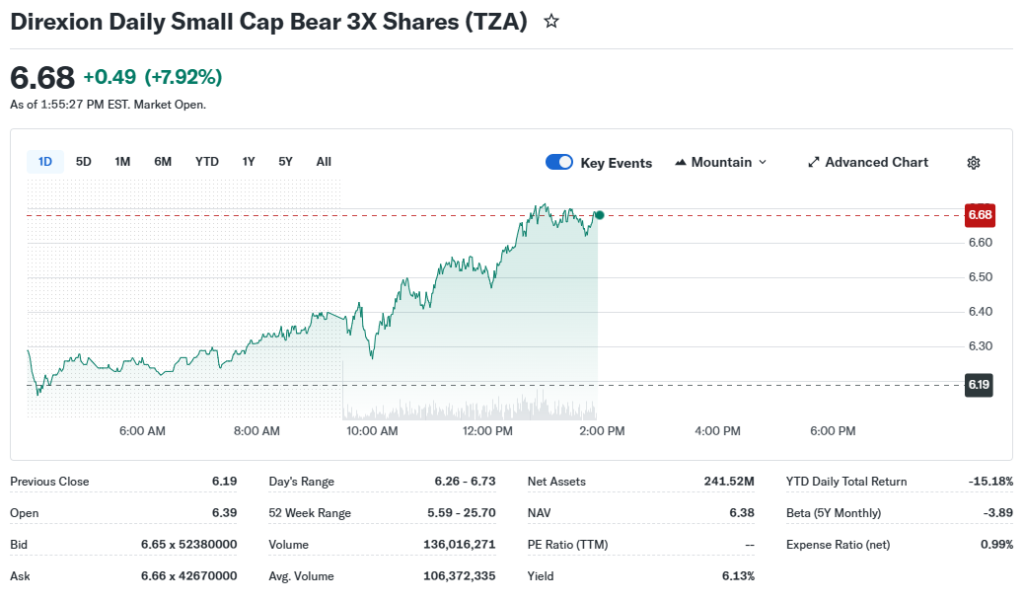
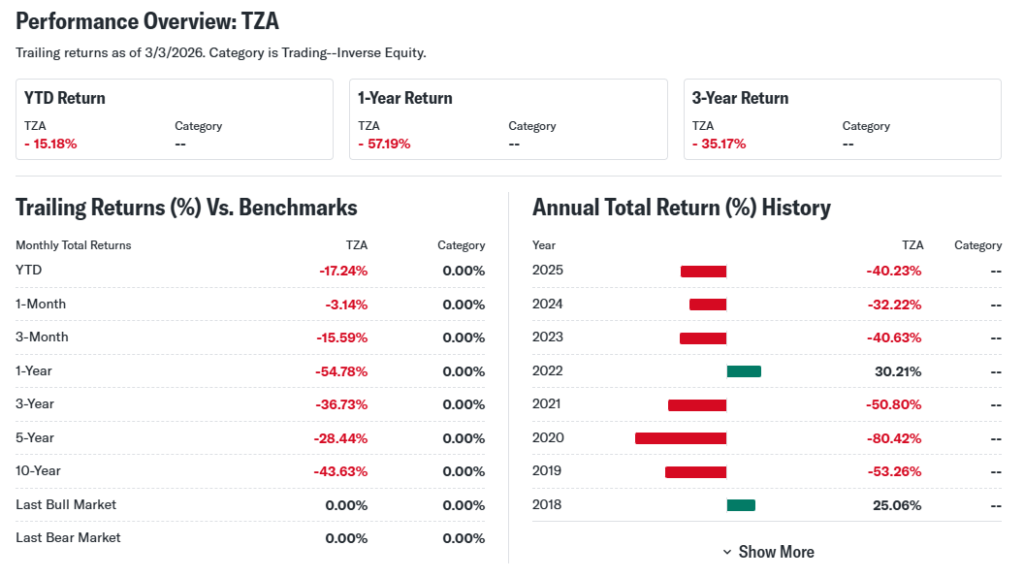
Over the last 3 months, NAV performance for TZA has dropped roughly 25 percent, and the 1‑year performance has declined over 40 percent, reflecting a strong rebound in the underlying Russell 2000 index. Year-to-date, returns are also negative, with YTD total return on Yahoo Finance showing a decline of more than 15 percent at one recent snapshot. The 52‑week range for TZA ETF price runs from a low near 5.59 dollars to a high around 25.70 dollars, underscoring how volatile a 3x inverse ETF can be. Overall, the current trend appears bearish for TZA itself, which paradoxically implies a more constructive backdrop for small-cap stocks rather than for this bearish ETF. For investors, that means TZA ETF is currently more aligned with short-term tactical hedging than a sustained uptrend.
Technical Analysis
Technical analysis on TZA suggests the ETF remains in a downtrend across most time frames. The price currently trades below its 50‑day and 200‑day moving averages, with the 50‑day average around 8.41 dollars and the 200‑day near 12.45 dollars in one recent report, reinforcing a negative bias. When a shorter-term moving average sits below a longer-term one, it is often called a “death cross,” and it typically signals a bearish trend rather than a bullish golden cross. For a leveraged inverse ETF like TZA, that means small caps have been trending higher over recent months.
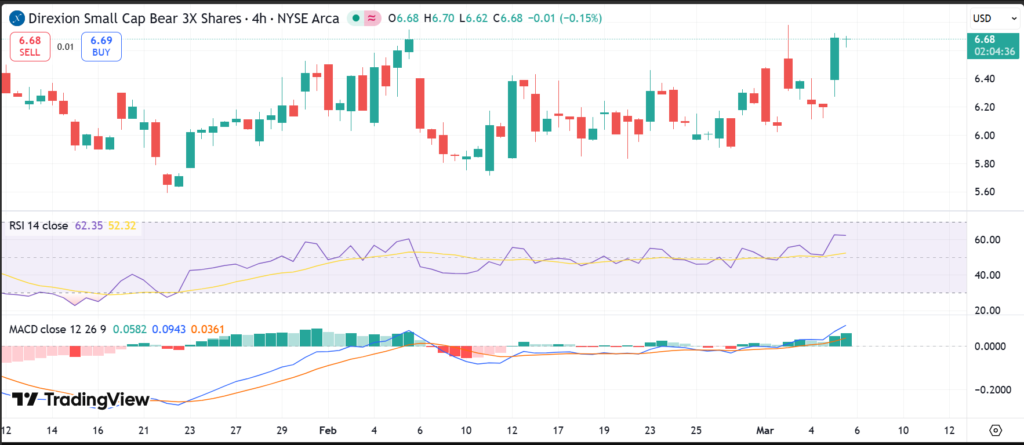
Relative Strength Index (RSI) readings around the low 40s on some technical dashboards place TZA in a neutral to slightly weak zone, not deeply oversold but far from overbought. RSI measures the speed and magnitude of price moves on a 0–100 scale, where readings above 70 can indicate overbought conditions and below 30 oversold conditions. MACD indicators from sources like Investing.com and other forecast tools show a negative MACD line, which is generally interpreted as a bearish momentum signal for TZA. Trading volume averages above 28–40 million shares, with recent daily volume surpassing that, suggesting that TZA ETF remains highly liquid for short-term traders. In simple terms, technical analysis for TZA ETF technical analysis points to ongoing weakness in the ETF, which in turn implies strength in the underlying small-cap market.
Support and resistance are key concepts here. Recent price action suggests near-term support not far above the 52‑week low around the mid‑5 dollar area, while resistance appears in the high‑6 to 7 dollar zone and further up near the declining 50‑day moving average. These zones can act as psychological barriers where traders reassess risk.
Analyst Ratings & Price Targets
Leveraged and inverse ETFs like TZA tend to receive fewer traditional Wall Street ratings than individual stocks, so formal “Buy/Hold/Sell” counts are limited. MarketBeat, MLQ.ai, and similar platforms often do not list a conventional consensus rating for TZA, reflecting its use as a trading tool rather than a long-term investment. Some quantitative forecast sites present 12‑month TZA forecast targets, with one model citing an average 12‑month TZA ETF price target near the mid‑teens, implying over 100 percent upside from a recent 6 dollar level, though these are model-based rather than broker-driven estimates. The same source references a high target just under 15 dollars and a low target around the mid‑14 dollar area.
Other automated technical services classify TZA as a “Sell” or “Strong Sell,” based on the majority of indicators pointing lower. One forecast platform summarized technical signals as 1 Buy, 10 Sell, and 6 Neutral, leading to a strong negative overall rating. For everyday investors, this means analyst sentiment and TZA forecast tools generally view the ETF as a high-risk, trend-following hedge rather than a core holding. It also implies that “Is TZA ETF a buy?” is largely a question of short-term market view, not long-term fundamentals.
Insider Activity
Because TZA is an ETF rather than an operating company, it does not have classic corporate insiders buying or selling company stock. There are no CEO or executive share-sale filings like you would see with an individual technology stock. Instead, flows into and out of TZA come from institutional and retail traders adjusting positions based on their expectations for small-cap performance. One measure of sentiment is fund flows: TradingView notes that TZA recorded roughly 112 million dollars of net fund inflows over a prior 1‑year period in one snapshot, pointing to intermittent demand for small-cap downside protection.
Large creations or redemptions of TZA shares can signal shifts in market positioning. Rising shares outstanding or assets under management near 240–308 million dollars show that investors have used TZA ETF as a tactical hedge during periods of small-cap stress. However, these are not “insider trades” in the traditional sense, so they should be interpreted as aggregate sentiment rather than management confidence or caution.
Valuation Analysis
Traditional valuation metrics like trailing P/E, forward P/E, and price-to-sales do not directly apply to TZA ETF because it is a derivative-based, inverse leveraged product, not a company with earnings and revenue. Yahoo Finance and other data providers often show P/E ratios as not meaningful or simply leave them blank for TZA, since its value is driven by swaps, futures, and short positions tied to the Russell 2000, rather than by cash flows. Key fund-level fundamentals instead include net assets of roughly 240–310 million dollars, a net expense ratio around 0.99–1.04 percent, and a dividend yield approximately in the 5.8–6.2 percent range in recent data.
From a balance-sheet perspective, TZA’s holdings are largely money market instruments and cash equivalents used as collateral for derivatives exposures, rather than traditional operating assets. For example, one holdings snapshot shows large allocations to government cash management and Treasury instruments, along with minimal direct equity exposure. As a result, comparing TZA valuation to companies like Microsoft or Zoom is not meaningful; instead, investors should compare it with other inverse and leveraged small-cap ETFs. Given its specialized structure, the main “valuation” question is whether the cost (expense ratio, decay from daily rebalancing, and tracking error) is justified by the hedging benefit. For long-term holding, the structural decay often makes TZA ETF appear expensive relative to simply shorting small-cap exposure or using options.
Recent Earnings & Catalysts
TZA does not produce “earnings” in the usual corporate sense, so there are no quarterly earnings calls or EPS beats to analyze. Instead, TZA ETF earnings-like outcomes are the returns delivered relative to the Russell 2000 index, on a daily leveraged inverse basis. Performance history on Yahoo Finance shows that TZA’s YTD and 1‑year total returns have been sharply negative during periods of strong small-cap rallies, highlighting how macro and index-level catalysts dominate. Conversely, in risk-off environments where small caps fall sharply, TZA can surge over very short horizons.
Major catalysts for TZA ETF performance include changes in Federal Reserve policy expectations, surprises in U.S. economic data, shifts in small-cap credit spreads, and broad risk sentiment. There are no AI integrations, product launches, or corporate partnership announcements to track, since this is a passive inverse ETF. For investors, the key takeaway is that TZA ETF price reacts quickly to macro news impacting small caps, rather than to company-specific earnings.
Bullish Case
A realistic bullish case for TZA ETF assumes a deterioration in the small-cap environment. If economic growth slows, credit conditions tighten, or investors rotate away from riskier small-cap names, the Russell 2000 could fall, potentially driving TZA higher by roughly three times the daily decline. Elevated volatility can also benefit short-term traders who time entries well, as leveraged inverse ETFs amplify daily moves. Additionally, the ETF’s relatively high liquidity and strong daily volume make it an accessible hedging vehicle for both active traders and institutions.
Another positive driver is the potential for market shocks: sudden risk-off events, geopolitical tensions, or unexpected policy missteps often hit small caps harder than mega-caps, and TZA ETF can respond strongly to such drawdowns. For investors with a short-term bearish view on small caps and strong risk management discipline, TZA can be a tactical tool.
Bearish Case
The bearish case for TZA ETF itself is essentially the bullish case for small caps. If the U.S. economy avoids recession, earnings stabilize or grow, and rate expectations ease, the Russell 2000 can rise, driving TZA lower at a leveraged pace. Over the last year, that scenario has already played out, with TZA’s NAV performance down more than 40 percent as small caps rallied. Moreover, daily rebalancing and compounding create path dependency: over time, even a flat or choppy underlying index can lead to value erosion in a 3x inverse product.
TZA also carries significant risk of sharp intraday moves, given its historic volatility levels around 55–75 percent in some technical summaries. Expense ratios near 1 percent are materially higher than plain-vanilla index ETFs, adding to long-term drag. For long-horizon investors, these factors can make TZA ETF a poor buy-and-hold choice, amplifying downside risk when timing is off.
Market Sentiment & Investor Psychology
Market sentiment around TZA ETF is best understood by looking at technical ratings, flows, and trading activity rather than classic short interest data on a company. Several technical platforms currently classify TZA as a “Sell” or “Strong Sell,” reflecting the prevailing uptrend in small caps. One AI-driven analysis lists 17 technical indicators with only a single Buy signal against numerous Sell signals, reinforcing the bearish view on TZA itself. At the same time, significant trading volume and previously noted fund flows indicate that traders actively use TZA to express short-term bearish views and hedge portfolios.
Institutional ownership tends to be more tactical, with hedge funds and active managers using TZA for short-term exposure rather than long-term positioning. Retail investors are sometimes drawn by the potential for large percentage gains, but that momentum bias can be dangerous if they underestimate volatility and decay. Overall sentiment appears neutral to cautious: investors recognize TZA ETF’s usefulness as a hedge, but most professional sources warn against treating it as a long-term investment.
Short-Term Outlook
In the near term, the short-term TZA forecast will largely track expectations for small-cap volatility and macro headlines. Technicals show TZA trading below key moving averages with neutral-to-weak RSI, indicating that the prevailing trend remains down unless a fresh risk-off catalyst emerges. Volume is robust, so any sudden shift in sentiment could translate quickly into price moves. Given the current technical stance and model-based TZA ETF technical analysis ratings skewed toward Sell, the base case is for continued choppy to downward action in TZA unless the Russell 2000 comes under renewed pressure.
For traders, this suggests a cautious approach: short-term entries might be considered around support areas only if there are clear catalysts for small-cap weakness, and strict stop-loss levels are essential. No short-term view should be taken as a guaranteed TZA ETF price prediction, but probabilities currently lean against a sustained upside move without a macro shock.
Medium to Long-Term Outlook
Over a 6–24 month horizon, the most important variables for TZA ETF are the strength of the U.S. economy, inflation trends, and the rate path of the Federal Reserve. If small-cap earnings and revenue growth improve and credit conditions remain supportive, the Russell 2000 could continue to recover, which would be structurally negative for TZA. In that environment, long-term investors would generally be better served by long-only small-cap exposure rather than a leveraged inverse vehicle.
However, if a meaningful downturn or credit stress scenario emerges, TZA could see rapid spikes, making it a potentially effective hedge during specific windows. Because daily compounding and high expenses erode returns over time, most professional commentary suggests avoiding TZA for multi-year holding periods. For long-term investors, the most appropriate stance is typically to keep TZA ETF on a watchlist or use it tactically rather than to accumulate it as a core position.
FAQ Section
- Is TZA ETF a buy right now?
TZA ETF is generally viewed as a short-term trading and hedging tool rather than a buy-and-hold investment, and many technical services currently rate it as a Sell or Strong Sell. Whether it is suitable depends entirely on your view of near-term small-cap downside and your risk tolerance. - What is the price target for TZA ETF?
One quantitative forecast source cites an average 12‑month TZA ETF price target near the mid‑teens, implying over 100 percent upside from recent levels, with a tight high–low range. These are model-based projections, not traditional Wall Street analyst targets, and they carry significant uncertainty.
- What are the major risks for TZA ETF?
Major risks include leveraged losses if small caps rally, path-dependent decay from daily rebalancing, high volatility, and higher fees compared to standard index funds. Holding TZA ETF for extended periods without active risk management can lead to large and persistent drawdowns. - How does TZA ETF generate returns without earnings?
TZA ETF returns come from derivatives such as swaps, futures, and short positions that track three times the inverse daily performance of the Russell 2000, not from company earnings. Its “earnings” are effectively the daily trading results of those instruments. - What is TZA ETF’s long-term outlook?
In the long term, TZA’s performance will depend on repeated and severe small-cap drawdowns, which are unpredictable, while ongoing compounding and fees likely erode value over time. Most long-term investors are better off treating TZA ETF as a tactical hedge rather than a permanent holding.
Suggestions
You could naturally include links in your article using anchor texts such as:
“Compare with SOXS ETF for a different volatility profile in tech-related exposure.”
“See our Microsoft ETF forecast for a long-only mega-cap perspective.”
“Read our tech sector valuation breakdown to understand how small caps stack up against large-cap technology leaders.”
These internal links help readers move from a TZA ETF valuation discussion to broader sector and alternative ETF comparisons.
Conclusion
TZA ETF offers focused, three-times inverse exposure to U.S. small-cap stocks, making it a powerful but risky tool for hedging or short-term speculation. Current trends show TZA under pressure as small caps have improved, and most technical dashboards classify it as a Sell or Strong Sell. Traditional valuation metrics do not apply, and daily compounding plus higher fees create strong headwinds for long-term holders. For most everyday investors, TZA ETF is best categorized as a Watchlist/Hold for tactical traders, not a core “buy and forget” position.
Disclaimer: This article is for informational purposes only and not financial advice.