
TSLL Technical Analysis: Trend, Levels & Outlook March 2026
Direxion Daily Tesla Bull 2X Shares (TSLL) is a leveraged exchange-traded fund designed to deliver two times (2x) the daily performance of Tesla stock. This ETF belongs to the leveraged equity ETF sector and is primarily used by traders seeking amplified exposure to the electric-vehicle industry and the broader growth-technology market. Because TSLL tracks Tesla with leverage, it tends to experience larger price swings than the underlying stock, making it popular among short-term traders and momentum investors.
Traders are closely watching TSLL in March 2026 as Tesla remains one of the most influential stocks in the technology and EV sectors. The ETF’s volatility often increases during periods of earnings announcements, macroeconomic news related to interest rates, and changes in sentiment toward growth stocks. This article examines TSLL’s current technical trend, key support and resistance zones, and what indicators like RSI, MACD, and volume may be signaling for the coming weeks.


Current Price Trend in March 2026
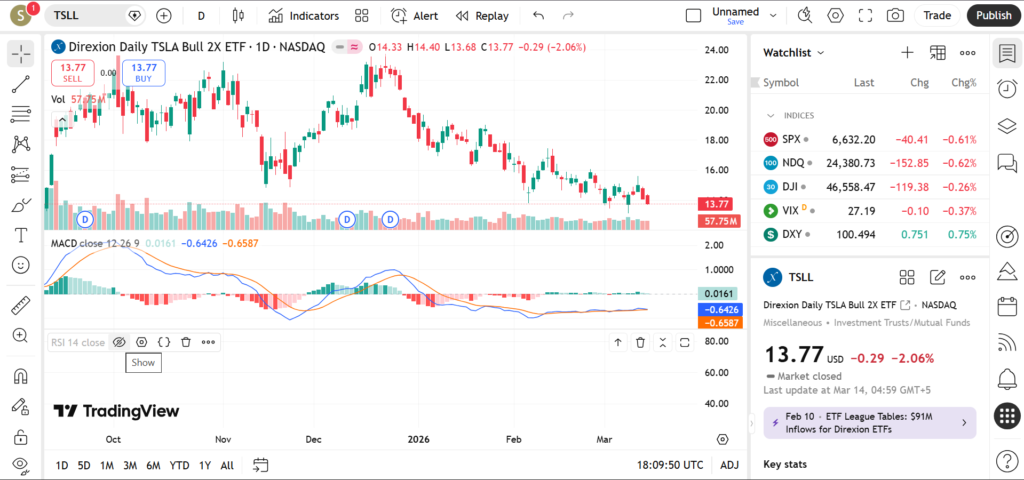
During March 2026, TSLL has been showing high volatility with a short-term consolidation pattern following large swings earlier in the year. Leveraged ETFs often exaggerate market movements, and TSLL has reflected Tesla’s recent fluctuations between bullish rebounds and cautious pullbacks.
In the short term, the ETF has been moving within a range between recent swing lows and prior resistance zones, indicating that traders are waiting for stronger catalysts before committing to a clear direction. The 20-day moving average has been acting as a near-term trend guide, with price frequently crossing above and below it during periods of consolidation.
The 50-day moving average currently sits slightly above recent price levels, suggesting the ETF has experienced a pullback from earlier highs. When price trades below this average, it often indicates a cooling momentum phase after strong rallies. Meanwhile, the 200-day moving average remains a key longer-term trend indicator. As long as price remains above this level, the broader trend structure from late 2025 could still be considered constructive.
Recent price swings have shown rapid rebounds followed by quick retracements, a typical pattern in leveraged ETFs tied to volatile underlying assets. This type of price behavior often suggests that short-term traders are dominating activity rather than longer-term investors.
For educational purposes, many traders watch how leveraged ETFs behave around moving averages because trend continuation often occurs when price holds above shorter averages, while breaks below them may signal deeper consolidation.
Key Support and Resistance Levels
Support and resistance levels help traders identify areas where price historically reacted. In a volatile ETF like TSLL, these zones often correspond with Tesla’s key price movements as well.
Important support levels for TSLL in March 2026 include:
- Recent swing low zone: This level represents the most recent price area where buyers stepped in after a sell-off. If TSLL returns to this region, traders may watch for signs of stabilization.
- 50-day moving average area: Moving averages often act as dynamic support during uptrends. If TSLL approaches this level again, it could attract buyers looking for trend continuation.
- 200-day moving average zone: This is a critical long-term technical level. A sustained move below it could suggest a deeper correction phase in the ETF.
On the upside, several resistance levels may influence TSLL’s movement:
- Recent swing high: This is the nearest resistance created during the most recent rally attempt.
- Prior consolidation ceiling: Price previously struggled to break above this area, making it an important level traders monitor.
- Psychological round-number resistance: Leveraged ETFs often react strongly near round numbers as traders place orders around these zones.
If TSLL manages to break above its recent swing highs with increasing volume, it might indicate renewed bullish momentum in Tesla and related growth stocks. On the other hand, a break below recent support could signal that sellers remain in control, potentially leading to further consolidation or retracement.
Indicators – RSI, MACD, Volume
Technical indicators help traders evaluate momentum and market sentiment without relying solely on price levels.
The Relative Strength Index (RSI) for TSLL has recently moved within the neutral range, suggesting the ETF is neither strongly overbought nor oversold. When RSI stays between 40 and 60, it often indicates a consolidation phase where the market is searching for direction. Traders may watch for RSI moving above 60 as a sign of strengthening momentum or dropping below 40 as a sign of increasing selling pressure.
The MACD indicator currently reflects a mixed momentum environment. Earlier bullish crossovers were followed by periods where the MACD line began to flatten, indicating that upward momentum slowed. When the MACD histogram begins shrinking toward zero, it often signals that the previous trend may be losing strength.

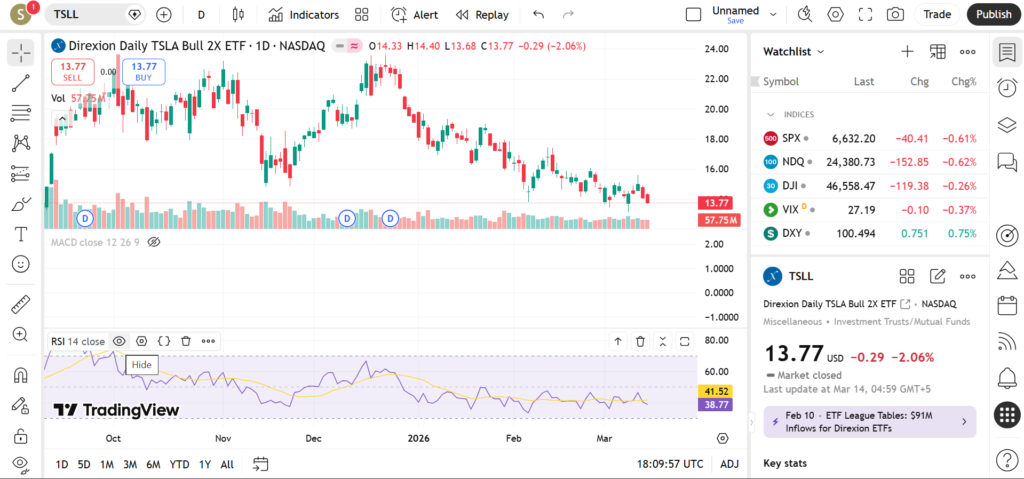
Volume patterns have also been interesting in recent sessions. Several large volume spikes occurred during strong price swings, indicating active participation from short-term traders. However, volume has sometimes declined during rallies, which can signal cautious sentiment. In technical analysis, rallies supported by rising volume are often considered stronger than those occurring on light trading activity.
Because TSLL is leveraged, volume spikes often coincide with rapid price moves, making it essential for traders to monitor whether increased participation supports or contradicts the direction of the move.
Short-Term Outlook for TSLL in March 2026
The technical outlook for TSLL in March 2026 appears mixed but highly reactive to Tesla’s stock movement. The ETF’s recent consolidation suggests that the market is balancing between bullish expectations for electric-vehicle growth and broader macro concerns affecting technology stocks.
If TSLL manages to hold above its key moving averages and break above recent resistance levels, the ETF could regain bullish momentum. However, continued sideways movement may persist if Tesla’s stock remains range-bound.
What traders are watching:
- Break above the most recent swing high, which could indicate renewed bullish momentum.
- Whether price holds above the 50-day moving average during pullbacks.
- Changes in Tesla sentiment due to earnings announcements or production updates.
- Broader market trends in technology and growth stocks.
- Macroeconomic factors such as interest rate expectations affecting high-growth companies.
Risks and Important Notes
Technical analysis provides useful insights, but it does not guarantee market outcomes. Leveraged ETFs like TSLL can experience rapid price swings due to their daily leverage structure, which amplifies both gains and losses.
Unexpected news events, economic data releases, or major company announcements can quickly invalidate technical levels. For example, developments related to electric-vehicle demand, supply chain changes, or macroeconomic policy shifts could significantly influence Tesla’s price and therefore TSLL.
Retail traders should remember that this article is for educational purposes only and does not represent personalized financial advice. Risk management strategies, such as careful position sizing and disciplined planning, remain important when trading volatile instruments like leveraged ETFs.
For further insights into the broader market, traders may also explore technical analysis of related ETFs such as semiconductor funds, small-cap indices, or volatility-based products. Comparing multiple sectors often provides a clearer understanding of market trends and risk sentiment.