TSLG ETF offers leveraged 2X exposure to Tesla; explore TSLG ETF price, earnings-linked moves, and whether TSLG ETF is a buy with a clear technical and valuation breakdown.
Data as of April 21, 2026
Introduction
The TSLG ETF (Leverage Shares 2X Long TSLA Daily ETF) is a leveraged exchange‑traded fund that aims to deliver twice the daily return of Tesla Inc. (TSLA) stock, without paying dividends. It is designed for short‑term traders rather than long‑term buy‑and‑hold investors, and has attracted attention as Tesla’s stock swings on earnings, AI news, and regulatory developments. Right now, investors are watching the TSLG ETF price closely because of its amplified risk and volatility versus the broader tech and AI‑focused ETF space.
TSLG ETF price: What’s happening now
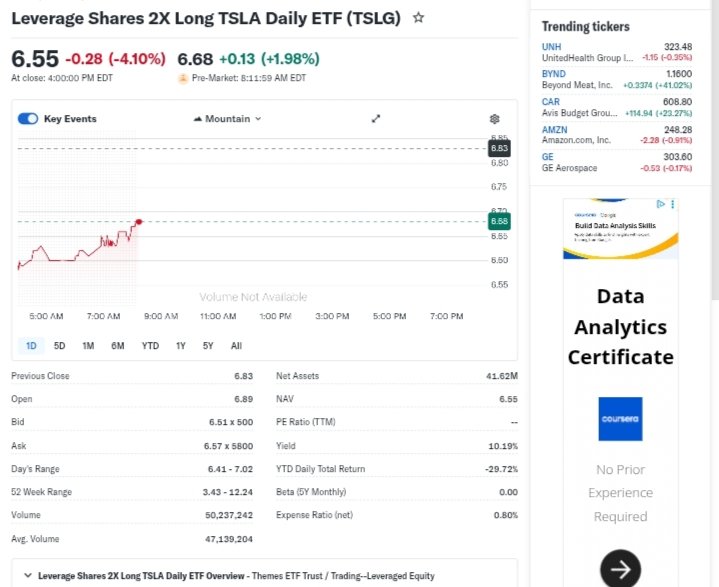
As of the latest market close on April 21, 2026, the TSLG ETF trades around $6.54–6.83, depending on the data source and intraday timing
- 1‑day performance: TSLG is down roughly 4–5% from the prior close, reflecting a sharp pullback after a spike in Tesla’s share price.
- 5‑day trend: Over the past five days, the TSLG ETF price has swung up and down with Tesla’s volatility, but overall is slightly lower than the level five days ago.
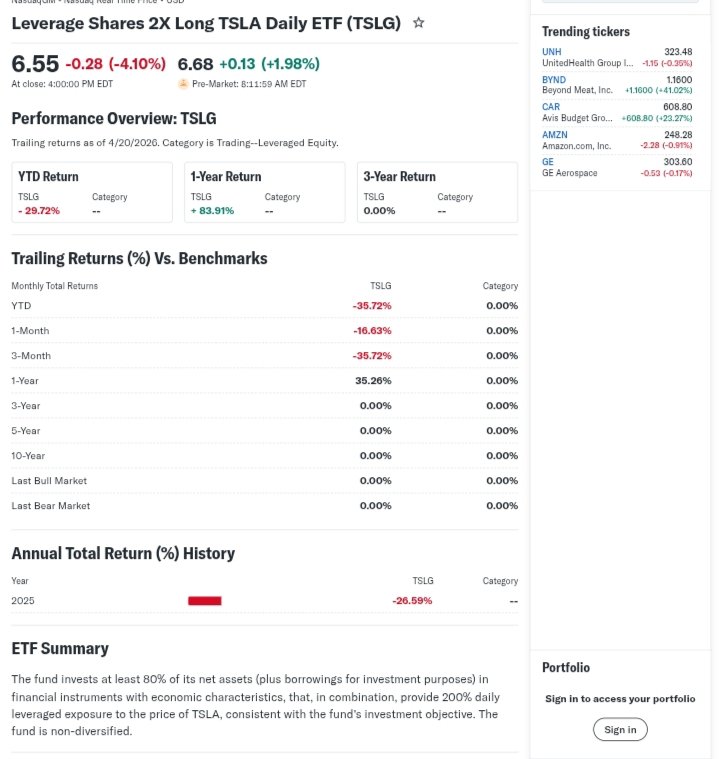
- 1‑month trend: In the last month, TSLG is down about 2–3%, trailing Tesla’s own modest gains.leverageshares+1
- 3‑month trend: Over three months, TSLG has fallen roughly 20–22%, as Tesla’s stock has been under pressure.
- 6‑month trend: During the past six months, TSLG has underperformed, with a large double‑digit percentage loss versus Tesla’s returns.l
- Year‑to‑date (YTD): As of April 21, 2026, TSLG’s price is down about 26–27% year‑to‑date.
- 52‑week high / low: The 52‑week range for TSLG is about $3.11–$12.24, placing the current price closer to the lower half of that band.
The overall trend is bearish to sideways, with the TSLG ETF price moving lower over the past several months despite Tesla’s positive 12‑month returns. This suggests that the leveraged structure and compounding effects are working against holders in a choppy, mean‑reverting market. For investors, that means using TSLG mainly as a tactical, short‑term instrument rather than a core long‑term holding.
TSLG technical analysis for beginners
Technical analysis for the TSLG ETF focuses on how the price trades versus its recent highs, lows, and averages.
Support and resistance
- Support: Recent data points to support around $5.00–$5.30, where buying interest has appeared in the past.kraken+1
- Resistance: Resistance clusters near $7.00–$7.50, an area from which the TSLG ETF price has previously pulled back
If the TSLG ETF price breaks above resistance with strong volume, it may indicate renewed short‑term bullish momentum; if it falls below support, the downside could extend toward $4.50–$4.00.
Moving averages and “crosses”
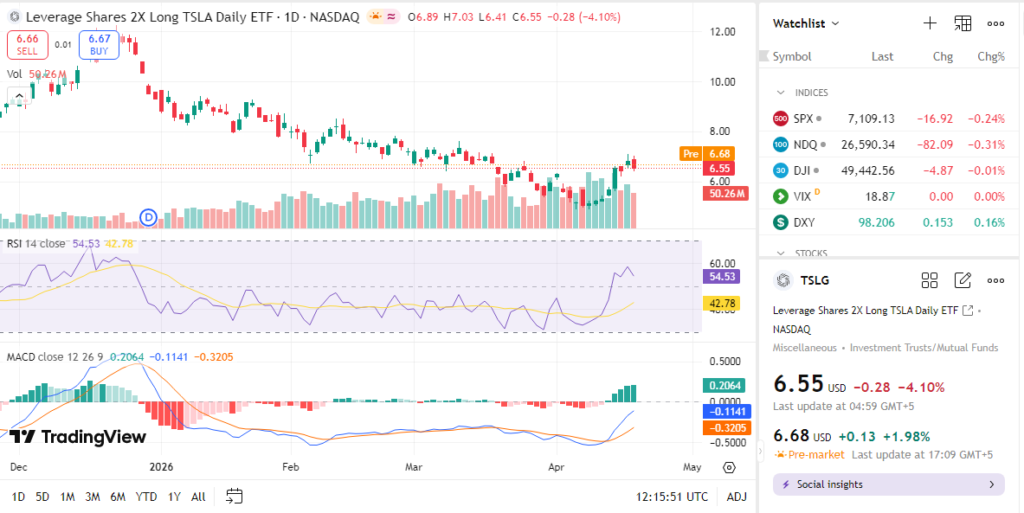
- The 50‑day moving average is currently below the latest price, signaling that short‑term momentum is still weak
- The 200‑day moving average sits higher than the 50‑day, indicating that the long‑term trend is mixed and not clearly bullish. There is no golden cross (50‑day above 200‑day), only a series of volatile swings.
In simple terms, this structure suggests a choppy, uncertain environment where rallies are quickly sold into, rather than a clean uptrend.
RSI and MACD
- RSI (Relative Strength Index): Recent readings place RSI near neutral or slightly oversold, hinting that the TSLG ETF may be overextended lower and due for a short‑term bounce, but not yet in a classic “oversold rebound” zone.
- MACD (Moving Average Convergence Divergence): The MACD line is generally below the signal line, reflecting bearish short‑term momentum; a crossover above the signal line would be needed to signal a bullish shift.
Trading volume
- Daily trading volume for TSLG is high, often in the millions of shares, which keeps liquidity strong but also amplifies intraday swings.
- When volume spikes on down days, it usually signals strong selling pressure and can extend bearish moves.
For beginners, this technical picture implies that the TSLG technical analysis environment favors short‑term trades with tight stops rather than passive holding.
Analyst ratings and price targets for TSLG ETF
Unlike a regular stock, there are no traditional analyst price targets for the TSLG ETF, because it is a leveraged, daily‑reset ETF tied to Tesla’s price.
Instead, research platforms and data services focus on whether TSLG fits the investor’s risk profile and time horizon.
- Sentiment indicators: Some scoring systems label TSLG as a “buy”‑rated name on a short‑term basis when Tesla’s trend is positive, but downgrade it to “sell” or “hold” when volatility spikes.
- Wall Street‑style commentary: Providers such as MarketChameleon and similar platforms note that TSLG outperforms when Tesla rallies strongly, but underperforms in sideways or choppy markets.
In practice, this means that asking “Is TSLG ETF a buy?” is better answered by whether you want leveraged Tesla exposure for a few days or weeks, not by a conventional analyst rating.
Insider activity and fund‑flow signals
Because TSLG is an ETF rather than an operating company, there is no insider buying or selling by executives in the traditional sense
However, fund‑flow data act as a proxy for investor behavior:
- Over the past year, TSLG has seen large positive fund flows totaling around $36–37 million, showing that traders have been adding exposures ahead of strong Tesla runs.
- At the same time, the NAV and share returns over the last three months and year are negative, indicating that many investors have rush‑entered near tops and then sold at lower levels.
This pattern suggests herding behavior: investors pile in after Tesla announces earnings beats or AI‑related news, then exit when the trend stalls. For TSLG ETF, this reinforces the idea that it is more of a trading vehicle than a long‑term buy‑and‑hold asset.
Valuation analysis: Is TSLG ETF overvalued?
The TSLG ETF does not have standard valuation ratios such as P/E or price‑to‑sales, because it is a leveraged vehicle that tracks Tesla’s price minus fees, not a company with its own earnings.
- Price source: The TSLG ETF price is driven by Tesla’s stock price, the 2X leverage factor, and the fund’s expense ratio (about 0.75% annually).
- Implied “valuation”: When Tesla trades at a high P/E already, the TSLG ETF effectively doubles that risk without offering a valuation discount; in downturns, it magnifies losses compared with holding Tesla directly.
In that context, the TSLG ETF appears fairly valued as a leveraged product, but expensive in terms of risk‑adjusted reward for most long‑term investors. The correct way to think about TSLG valuation is through risk, holding period, and volatility, not through traditional earnings multiples.
Recent earnings and major catalysts
TSLG itself does not report earnings; instead, it mirrors Tesla’s quarterly results and guidance.
- Tesla’s recent quarters: Tesla has posted mixed earnings results, with revenue roughly in line or slightly above expectations but EPS sometimes pressured by margin challenges and investments in AI and infrastructure.money.
- Tesla’s guidance: Management has emphasized growth in AI, autonomy, and energy products, which tend to support Tesla’s stock in the short term and thereby lift TSLG on a leveraged basis.
Each time Tesla reports earnings beats or optimistic guidance, the TSLG ETF price often spikes sharply, but also tends to give back gains quickly if the broader market or Tesla’s stock remains choppy.
Bullish case for TSLG ETF
The bullish case for the TSLG ETF rests on a few clear, realistic drivers:
- Strong Tesla rallies: When Tesla stock surges—as it did over the past year with an 80%+ gain—the TSLG ETF can deliver double‑digit, leveraged returns for short‑term traders.
- High liquidity: Average daily volume in the millions of shares keeps spreads tight and allows for quick entries and exits.
- AI and tech momentum: If the broader tech and AI‑themed ETFs rally again, Tesla is likely to benefit, and by extension so will TSLG on a leveraged basis.
However, these positives are mostly relevant for short‑term traders, not for long‑term investors who want to compound returns over years.
Bearish risks for TSLG ETF
There are several real downside risks that investors considering “Is TSLG ETF a buy” should weigh:
- Volatility decay: Because TSLG resets leverage daily, prolonged sideways or choppy markets erode returns even if Tesla’s long‑term trend is positive.
- Short‑term drawdowns: Over the past three months, TSLG has fallen about 20–22%, far more than Tesla’s decline, highlighting the pain of leverage in corrections.
- Tesla‑specific risks: Tesla faces competition in EVs, margin pressure, and regulatory scrutiny, any of which can trigger sharp Tesla sell‑offs and magnified TSLG moves.money.
These factors make TSLG better suited for short‑term tactical bets than for core portfolio exposure.
Market sentiment and investor psychology
Current market sentiment around the TSLG ETF is best described as cautiously opportunistic:
- Short interest: As a leveraged ETF, TSLG is often used by traders on both sides, but there is no clear, dominant short‑squeeze narrative at present.
- Options activity: Options volume tends to spike around Tesla earnings dates, with traders positioning for big moves in either direction
- Institutional vs retail: Retail investors dominate TSLG trading, while institutions prefer holding Tesla directly or using other hedging instruments.
Overall, sentiment leans momentum‑driven and short‑term, with investors jumping in on rallies and exiting quickly on pullbacks.
Short‑term outlook
For the next days to weeks, the TSLG ETF looks like a high‑risk, high‑volatility instrument:
- Technically, the ETF is near support zones around $5.00–$5.30, which could spark bounces if Tesla stabilizes.
- Momentum indicators (RSI, MACD) are weak or neutral, so a sharp oversold bounce is possible but not guaranteed.
- If Tesla stock breaks higher, TSLG can surge quickly; if Tesla drifts lower, TSLG may test new lows for the year.
For traders, this means using small position sizes, tight stop‑losses, and clear exit rules rather than holding through multi‑week swings.
Medium‑term outlook
Looking out 6–24 months, the TSLG ETF is unlikely to be a strong long‑term core holding.
- Tesla’s business model, growth in AI and energy, and brand strength support potential upside in Tesla itself, but the TSLG ETF’s daily leverage and volatility decay make it a poor vehicle for capturing that gradually.
- Historically, the TSLG ETF has lost money over the long run despite Tesla’s strong 1‑year returns, underscoring the cost of compounding leverage.
For long‑term investors, a better strategy is usually to hold Tesla directly or a non‑leveraged tech ETF, using TSLG only for short, targeted trades.
FAQ section
Is TSLG ETF a buy right now?
TSLG ETF is not a straightforward “buy” for most investors. It may suit short‑term traders who expect a sharp Tesla rally in the next few days, but it carries high risk and volatility.
What is the price target for TSLG ETF?
There is no official price target because TSLG is a leveraged ETF; its value depends entirely on Tesla’s price. Targets are better framed as Tesla‑price scenarios than as fixed dollar numbers.
What are major risks for TSLG ETF?
Key risks include volatility decay, sharp drawdowns during Tesla corrections, and overnight gap risk, especially around earnings or regulatory news.
What does TSLG ETF track?
TSLG ETF tracks 2X the daily return of Tesla Inc. (TSLA) stock, reset every day, and is designed for short‑term trading rather than long‑term investing.
Internal linking suggestions
- “Compare with Zoom ETF”
- “See our Microsoft ETF forecast”
- “Read our tech sector valuation breakdown”
Final balanced conclusion
For most investors, the TSLG ETF is best treated as a watchlist or short‑term tactical tool, not a core buy. It can be useful for experienced traders who want amplified exposure to Tesla’s price moves over a few days, but the leverage, volatility, and decay make it unsuitable for long‑term, passive portfolios.
Label: Hold / Watchlist (for trading only), not a core buy.
Disclaimer: This article is for informational purposes only and not financial advice.