
TQQQ Technical Analysis: Trend, Levels & Outlook March 2026
ProShares UltraPro QQQ (TQQQ) is a leveraged exchange-traded fund designed to deliver three times (3x) the daily performance of the Nasdaq-100 Index, making it a high-volatility instrument that attracts active traders and short-term speculators. The ETF belongs to the leveraged equity ETF sector, focusing heavily on technology and growth stocks since the Nasdaq-100 index is dominated by large technology companies such as semiconductor, software, and artificial intelligence leaders.
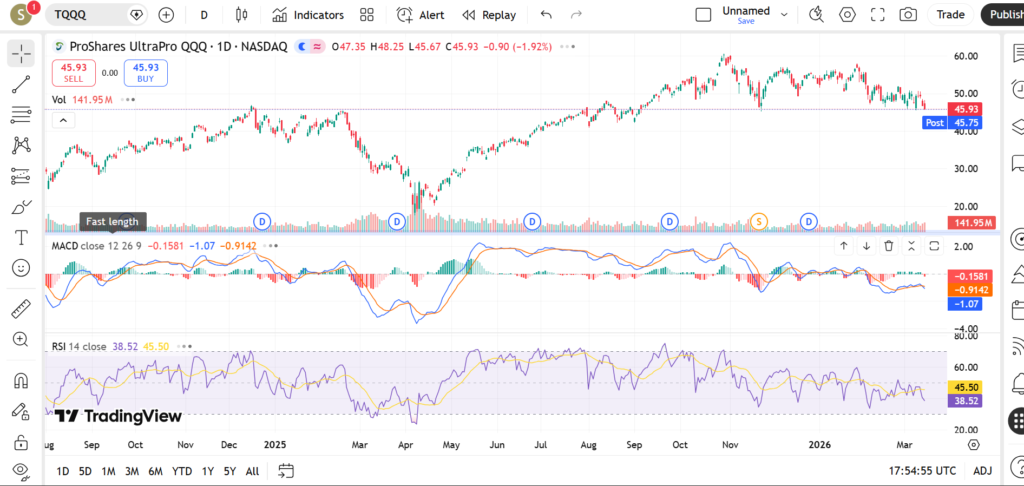
Traders are watching TQQQ closely in March 2026 as technology stocks continue to experience periods of strong momentum followed by sharp corrections. Leveraged ETFs tend to exaggerate these movements, making them attractive for traders looking to capitalize on short-term price swings. In this technical analysis article, we examine the current trend, important support and resistance levels, and key indicators such as RSI, MACD, and volume to help retail traders understand what the chart is currently signaling.
Current Price Trend in March 2026
During March 2026, TQQQ has been showing short-term consolidation with periods of volatility, reflecting mixed sentiment in the technology sector. The ETF experienced a strong rally earlier in the year as AI-related stocks continued attracting capital, but recent price action suggests that momentum has slowed as traders reassess valuations and macroeconomic signals.
From a moving average perspective, the 20-day moving average has recently started flattening, which often indicates that the previous short-term uptrend is losing momentum. Price has been oscillating around this average, suggesting a temporary balance between buyers and sellers.
The 50-day moving average remains a key intermediate trend indicator. TQQQ has generally remained above this level over the past few months, signaling that the broader trend is still constructive. However, repeated tests of this moving average may suggest that buyers are gradually becoming less aggressive.
Meanwhile, the 200-day moving average continues to act as a long-term support area that traders monitor closely. As long as price remains above this long-term average, many technical traders interpret the broader trend as bullish, though shorter-term corrections are still possible.
Recent price swings show a pattern of higher lows but slightly lower highs, which may indicate that the ETF is forming a temporary consolidation range. Such structures sometimes appear before the next directional move. Traders typically watch for a decisive breakout above resistance or breakdown below support to determine the next trend phase.
Key Support and Resistance Levels
Identifying key price levels is essential for understanding where buyers and sellers might become active.
Important Support Levels
One of the first support areas traders are monitoring is near the recent swing low formed earlier in March. This level previously attracted buyers during a short-term pullback, suggesting that market participants view it as a reasonable entry point.
Another notable support zone lies near the 50-day moving average. Moving averages often act as dynamic support in trending markets, and several previous pullbacks have stabilized around this area.
A deeper support region appears near the 200-day moving average, which represents the long-term trend indicator. If price were to approach this level, traders would likely watch carefully to see whether institutional buyers step in again.
Round-number price levels also tend to attract attention from market participants because they often correspond to psychological support zones.

Important Resistance Levels
On the upside, the first resistance level appears near the recent swing high formed during the latest rally. This level previously acted as a ceiling where selling pressure emerged, making it an important area to watch.
Another resistance zone sits slightly above that level, near a cluster of previous highs created during earlier consolidation phases. When multiple highs occur at a similar level, traders often interpret it as strong resistance.
Higher up, resistance could appear near the previous yearly highs, where momentum previously stalled.
If price manages to break convincingly above these resistance areas with increased volume, it could signal that buyers are regaining control. Conversely, failure to break resistance may lead to further consolidation or a pullback toward support levels.
Indicators – RSI, MACD, Volume
Technical indicators can provide additional context to price movements and help traders understand momentum conditions.
RSI
The Relative Strength Index (RSI) currently appears to be fluctuating in the neutral zone, neither in extreme overbought nor oversold territory. When RSI remains between roughly 40 and 60, it often indicates a market that is consolidating rather than trending strongly.
If RSI were to move toward the overbought region above 70, it might suggest strong bullish momentum but also potential short-term exhaustion. On the other hand, a drop toward the oversold region below 30 could indicate that selling pressure has become excessive and that a rebound might eventually occur.

MACD
The MACD indicator has recently shown signs of weakening momentum after a previous bullish phase. The MACD line and signal line appear to be converging, which sometimes precedes a crossover.
A bullish crossover could indicate that upward momentum is returning, while a bearish crossover might suggest that the short-term trend is turning downward.
Traders often combine MACD signals with support and resistance levels rather than relying on the indicator alone.
Volume
Volume patterns in TQQQ provide insight into trader participation. Recent rallies have shown moderate volume, which indicates that buyers are still present but not aggressively accumulating.
During pullbacks, occasional volume spikes have appeared, which can suggest that some traders are taking profits or adjusting positions.
A strong breakout above resistance would ideally be accompanied by increasing volume, as this typically confirms the strength of the move.
Short-Term Outlook for TQQQ in March 2026
Overall, the technical structure of TQQQ in March 2026 appears to reflect a consolidation phase following a strong rally earlier in the year. The ETF remains above key long-term moving averages, which keeps the broader trend constructive, but short-term momentum indicators suggest that the market is pausing before its next major move.
If buyers manage to push the ETF above the recent swing highs with strong participation, it could indicate that the technology sector is resuming its upward momentum. However, failure to break resistance may result in additional sideways trading or a deeper retracement toward longer-term support levels.
What traders are watching:
- A potential breakout above the recent swing high resistance zone
- Whether price continues holding above the 50-day moving average
- RSI movement toward bullish momentum territory
- Changes in volume during rallies or pullbacks
- Macro catalysts such as interest rate expectations or technology sector news
Risks and Important Notes
While technical analysis can provide valuable insights into market structure and trader behavior, it is important to remember that technical levels are not guaranteed to hold. Unexpected events such as economic data releases, geopolitical developments, or sudden shifts in investor sentiment can cause rapid market moves that invalidate chart patterns.
Leveraged ETFs like TQQQ also carry additional risks due to daily leverage and compounding effects, which can amplify both gains and losses. These products are typically designed for short-term trading rather than long-term holding.
This article is intended for educational purposes only and should not be interpreted as personalized financial advice. Traders should always conduct their own research and consider risk management strategies such as position sizing and stop-loss planning.
For additional insights, traders may also want to explore technical analysis of related ETFs such as QQQ, SPY, or other leveraged technology ETFs, as movements in these instruments often influence TQQQ’s price action. Understanding the broader market context can help traders interpret signals more effectively.