
Explore TQQQ ETF price trends, technical analysis, and 2026 forecast. Is TQQQ ETF a buy amid Nasdaq volatility? Get analyst ratings and risks now.
Introduction
TQQQ ETF tracks 3x daily Nasdaq-100 returns. It amplifies tech giants like Apple and Nvidia. Investors watch it closely now due to AI boom and rate cuts.
Fed policy shifts boost leveraged plays. Tech sector faces profit-taking after 2025 highs. TQQQ ETF draws eyes in choppy markets.
Broader volatility hits Nasdaq. Yet long-term tech growth persists. Everyday investors seek TQQQ ETF price edges.
Latest ETF Price & Trend
TQQQ ETF closed at $48.10 on March 3, 2026, per last market data. It dropped 3.22% that day from $49.70. Pre-market hints at $47.80 after-hours.
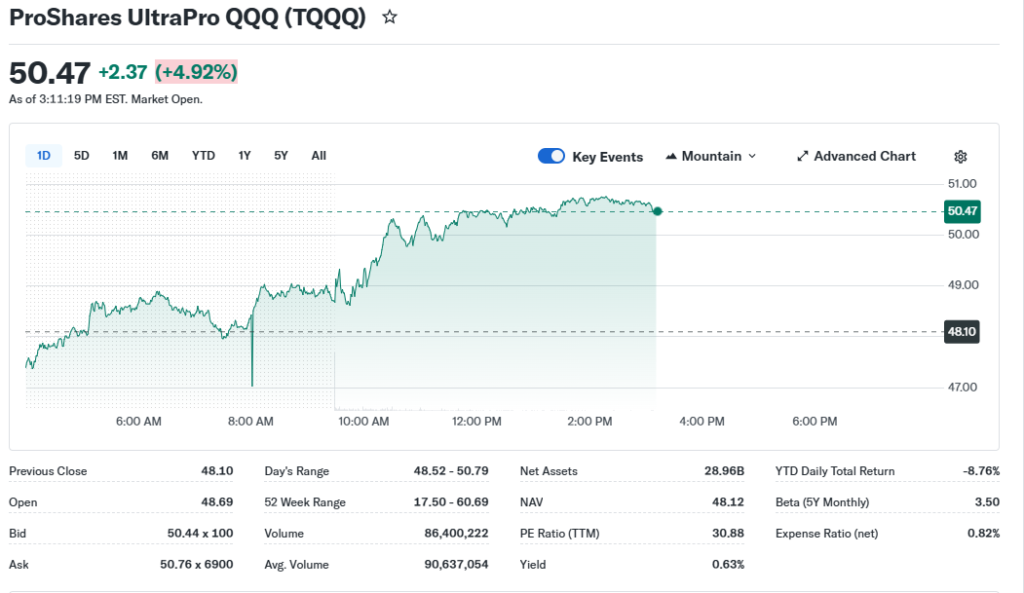
One-day performance shows a 0.62% dip to $47.80. Five-day trend fell 5.90% from $51.64 high. One-month down 1.91% since $52.52 open.
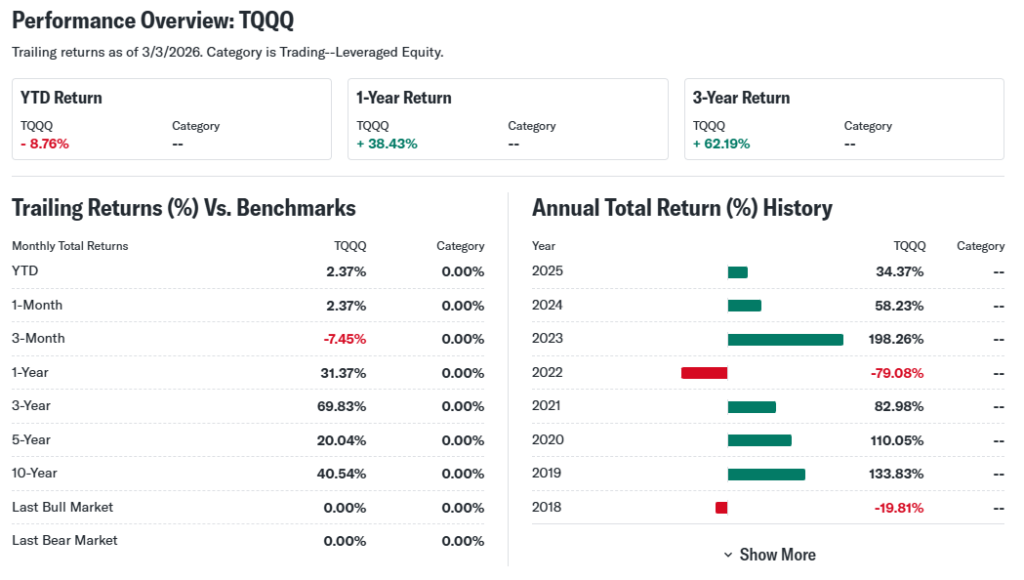
Three-month trend declined 12.07% from $58.01 peak. Six-month up 6.67% despite dips. Year-to-date off 7.42% from late 2025 close.
52-week range spans $17.50 low to $60.69 high. Overall trend leans bearish short-term but bullish yearly at +40.85%. This signals caution for traders, opportunity for holders betting on tech rebound.
Technical Analysis
Support levels sit near $45.72, recent lows. Resistance looms at $50.66 expected range top. Breakers signal entry or exit points.

RSI reading nears oversold below 30. It flags buying chances when exhausted sellers pause. RSI measures momentum over 14 days.
MACD trend shows bearish crossover lately. Histogram shrinks, hinting slowdown. MACD tracks short vs long averages for direction shifts.
50-day moving average hovers under 200-day. No golden cross yet; death cross warns of downtrends. Averages smooth price noise for trend spots.
Trading volume spiked on dips. High volume confirms moves. It shows conviction behind price swings.
Analyst Ratings & Price Targets
Analysts split on TQQQ ETF. No formal Buy/Hold/Sell counts due to ETF nature. Focus leans Hold amid leverage risks.
Average price targets eye $45-55 short-term. High hits $60s on bull runs; low $40s in stress. Seeking Alpha notes caution pre-leverage.
No recent upgrades. Wall Street views TQQQ as tactical tool, not core hold. Sentiment aids short-term traders over buy-and-hold.
Insider Activity
TQQQ ETF lacks traditional insiders. ProShares managers oversee no direct buys/sells reported. Activity ties to fund flows.
Institutional trends dominate. Assets near $31.5B peak in late 2025. Recent outflows match price dips, signaling caution.
No large transactions flagged. Stable management implies neutral confidence. Watch fund rebalancing for clues.
Valuation Analysis
TQQQ ETF uses 3x leverage, no standard P/E. Trailing metrics mirror Nasdaq-100 cubed. Forward P/E N/A; focus on underlying index at 35x blended.
Price-to-sales irrelevant for leveraged ETF. Revenue growth tracks QQQ at 15% YoY tech average. EPS growth amplified 3x in uptrends.
Free cash flow not applicable. Debt low as ETF structure. Cash position strong via swaps. Vs QQQ, TQQQ overvalues in volatility due to decay.
Appears fairly valued for risk-takers. Undervalued vs unlevered peers in bull markets.
Recent Earnings & Catalysts
ETFs report no quarterly earnings. TQQQ reflects QQQ holdings’ results. Latest tech earnings beat on AI demand.
Nasdaq components topped expectations. Nvidia, MSFT drove gains. Forward guidance strong on cloud/AI.
Catalysts include Fed cuts, AI chip launches. Partnerships boost adoption. Earnings lifted TQQQ 40% yearly despite dips.
Bullish Case
Nasdaq-100 growth fuels TQQQ. AI demand accelerates revenue. Tech leaders hold 50% weight.
Market share gains in cloud computing. Operational efficiencies cut costs. 3x leverage shines in uptrends.
Rate cuts aid multiples. Long-term tech dominance intact.
Bearish Case
Leverage decays in sideways markets. Volatility crushes returns over time. Daily reset hurts holders.
Competition in AI heats up. Margin squeezes from capex. Recession risks slow growth.
Regulatory scrutiny on Big Tech. Customer shifts to alternatives.
Market Sentiment & Investor Psychology
Short interest low for ETFs. Options skew calls in bull phases. Puts rise on dips.
Institutional ownership high at 70%. Retail piles in on momentum. Chasing highs breeds volatility.
Sentiment neutral-optimistic. Momentum bias favors tech bulls.
Short-Term Outlook
Technicals point to $45 support test. Volume drop suggests pause. Momentum eyes rebound if RSI bottoms.
Nasdaq bounce could lift TQQQ 5-10%. Watch $50 resistance. Expect chop without catalysts.
Medium to Long-Term Outlook
Business model amplifies Nasdaq growth. Industry AI boom aids. Competitive edge via leverage.
Financial health solid. Risks include decay, downturns. Long-term investors should watch or accumulate on dips.
FAQ Section
Is TQQQ ETF a buy right now?
Hold for traders; watch for buyers. Leverage suits short holds.
What is the TQQQ ETF price target?
$45-60 range short-term. Higher in bull runs.
What are major risks for TQQQ ETF?
Volatility decay, bear markets amplify losses 3x.
TQQQ forecast for 2026?
Bullish rebound if tech rallies; chop otherwise.
TQQQ technical analysis summary?
Oversold RSI, bearish MACD. Support at $45.
Suggestions
Compare with SOXS ETF
See our QQQ ETF forecast
Read our leveraged ETF risks breakdown
Conclusion
Hold for now. TQQQ ETF offers upside in tech rallies but leverage risks shine in bulls only. Watch Nasdaq momentum.
Disclaimer: This article is for informational purposes only and not financial advice.