

TPET stock surges 100%+ amid oil rally, but liquidity woes persist. Explore TPET stock price trends, earnings, technical analysis, and 2026 forecast for investors.
Introduction
Trio Petroleum Corp. (TPET) explores and develops oil and gas in California, Utah, and Canada. TPET stock draws eyes now due to a sharp rally tied to oil prices hitting $150 per barrel from Middle East tensions. Broader energy stocks rise as crude volatility shakes markets in March 2026.
Investors watch TPET stock closely. Energy demand fuels interest amid global supply fears. Yet cash burn raises red flags for this small-cap player.
Latest Stock Price & Trend
TPET stock closed at $1.71 on March 5, 2026, up 101% that day alone. One-day performance hit +101%, driven by pre-market oil hype. Five-day gains topped 178%, with shares jumping on crude surges.
One-month trends show 280%+ monthly lift, breaching June 2025 highs. Three-month data lacks detail, but recent volatility dominates. Six-month trends point up from $1.98 in June 2025, though yearly down 19%.
Year-to-date, TPET stock swings wildly, with 52-week high near recent peaks and low far below. Overall trend stays bullish short-term on oil momentum. Investors see opportunity in energy plays, but pullbacks loom from overextension. Data uses last known market close.
Technical Analysis
Support levels sit near $1.50, where recent dips found buyers. Resistance looms at $2.00, prior pivot highs. These matter as they signal buy or sell zones for traders.

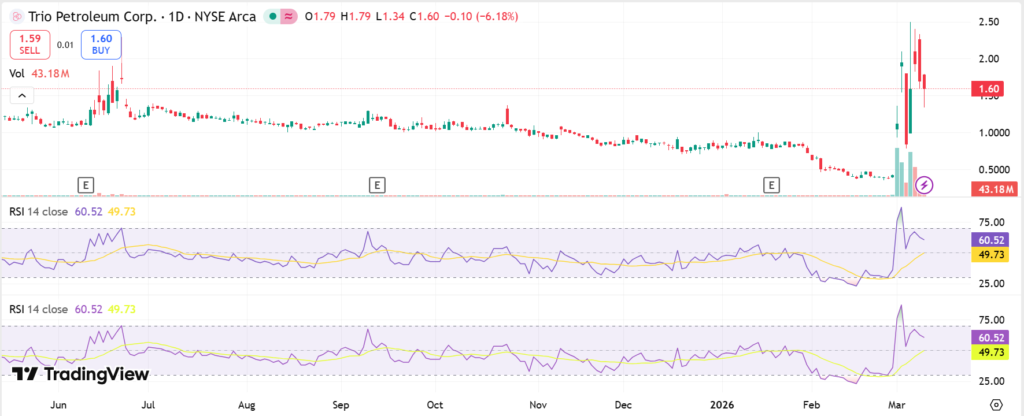
RSI reading nears overbought above 70 after the rally, hinting at cooldown risks. Overbought means momentum may fade soon.
MACD shows bullish crossover, but pivot top on March 3 warns of drops. This tracks momentum shifts via moving average lines.
50-day moving average crossed above 200-day, a golden cross for bulls. Volume spiked on surges, confirming interest. Trends suggest watch for reversals.
Analyst Ratings & Price Targets
Analysts rate TPET stock with no clear Buy/Hold/Sell count available. Average price target points lower over 12 months, low and high unspecified.
No recent upgrades noted from Wall Street firms like Bloomberg or Nasdaq. Sentiment lags price action.
This implies caution. Ratings reflect fundamentals over hype, guiding everyday investors on risks.
Insider Activity
No specific recent insider buys or sells detailed in filings. ATM offerings amended to $3.29 million show management raising cash via shares.
Convertible notes worth $1.2 million converted to stock in February 2026. This hints at dilution over confidence.
Trends lean toward liquidity moves, not strong buying. Implies caution amid cash needs. Check SEC Form 4 for updates.
Valuation Analysis
Trailing P/E unavailable due to losses. Forward P/E not listed. Price-to-sales strains with $13.8 million market cap.

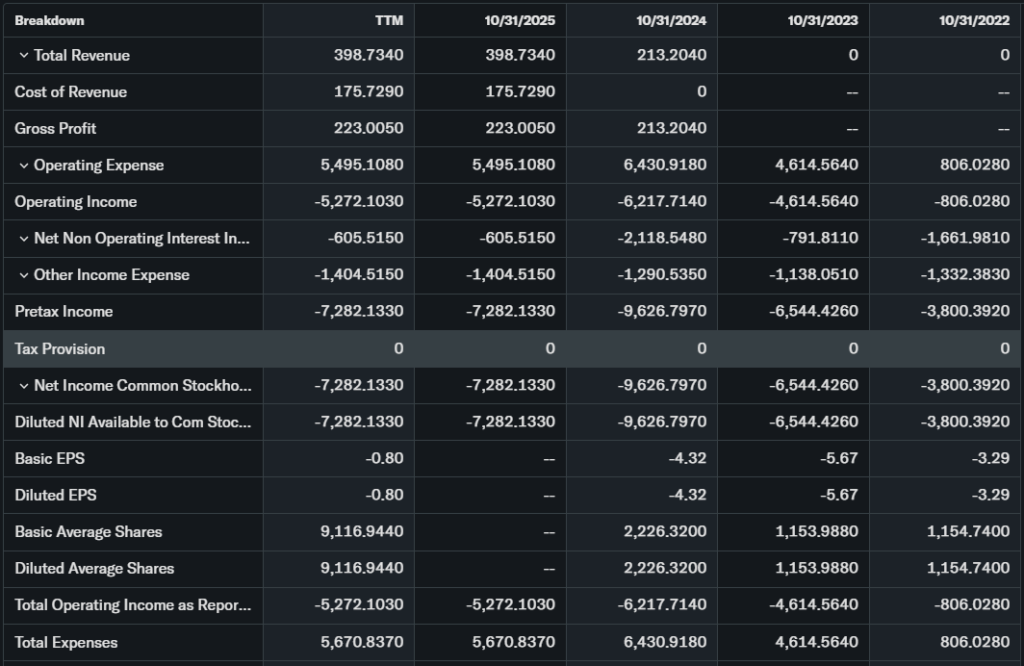

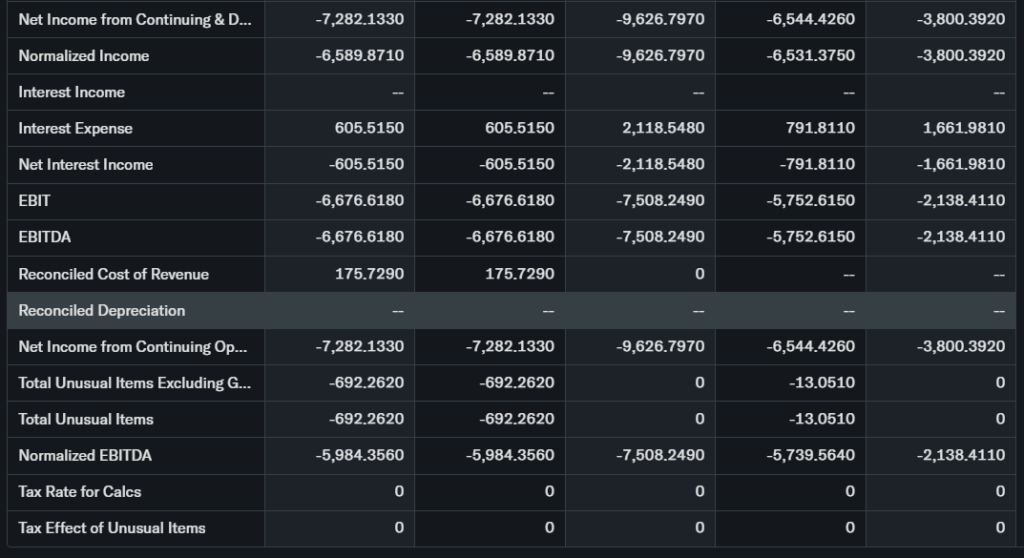
Revenue growth YoY unclear; EPS growth negative from cash burn. Free cash flow pressured, current ratio at 0.58 signals liquidity crunch.
Debt includes converted notes; cash position weak. Peers like larger oil explorers trade richer on scale.
TPET stock appears overvalued short-term post-rally, fairly valued if oil holds.
Recent Earnings & Catalysts
Earnings due March 16, 2026. No latest quarterly revenue or EPS vs expectations public yet.
Guidance absent; catalysts include ATM raise to $3.29 million and oil at $150. Note conversions boosted shares.
Stock soared on these, but dilution caps gains. Earnings will test rally.
Bullish Case
Oil prices at $150 drive demand for TPET assets. Exploration in key basins offers upside.
Recent 280% monthly surge shows momentum. ATM funds drilling if deployed well.
Operational updates could spark more gains in energy boom.
Bearish Case
Cash burn accelerates with 0.58 current ratio. Dilution from ATM and conversions erodes value.
Volatility extreme; 12.82% drop post-pivot. Competition from majors squeezes small firms.
Regulatory oil risks and economic slowdowns threaten.
Market Sentiment & Investor Psychology
Short interest data unavailable. Options activity favors calls on rally, per retail buzz.
Institutional ownership low; retail piles in on “huge upside.” Ownership trends favor momentum over value.
Sentiment skews optimistic short-term, fearful on fundamentals.
Short-Term Outlook
Technicals flash overbought RSI and pivot sell signals. Volume supports momentum, but cooldown likely.
Oil news sways next days. Expect volatility, possible pullback to support.
Medium to Long-Term Outlook
Business model ties to volatile oil. Industry growth hinges on crude demand.
Competitive moat thin vs giants; financial health shaky. Strategic ATM aids survival.
Long-term investors should watch, not accumulate yet. Hold if owned, eye earnings.
FAQ Section
Is TPET stock a buy right now?
Not yet; rally overextends amid cash woes. Wait for earnings pullback.
What is the price target for TPET stock?
Analysts see downside; specifics lag. Focus fundamentals.
What are major risks for TPET stock?
Liquidity crunch, dilution, oil price drops.
TPET stock forecast for 2026?
Volatile; tied to energy markets, potential drops post-rally.
TPET earnings date?
March 16, 2026. Key for guidance.
Suggestions
- Compare with [Opendoor stock analysis]
- See [energy sector forecast 2026]
- Read [small-cap energy valuation guide]
Conclusion
Watchlist TPET stock. Rally excites, but dilution and cash risks demand caution. Earnings could shift views.
Disclaimer: This article is for informational purposes only and not financial advice.