
Analyze TLT ETF price trends, technical analysis, and 2026 forecast. Is TLT ETF a buy amid rate uncertainty? Key insights on Treasury performance, yields, and risks.
Introduction
TLT ETF holds long-term U.S. Treasury bonds with 20+ year maturities. It rises when interest rates fall, serving as a safe haven for fixed income investors.
Investors watch TLT ETF now with Fed pause signals and inflation data. Bond ETFs react to rate expectations and Trump’s fiscal spending plans.
This review uses last market close data from BlackRock on March 4, 2026 at $89.12 NAV.
Latest ETF Price & Trend
TLT ETF NAV stood at $89.12 on March 4, 2026, down 0.32% that day.
Market price ranged $88.51-$88.94 on March 5, closing near $88.72.

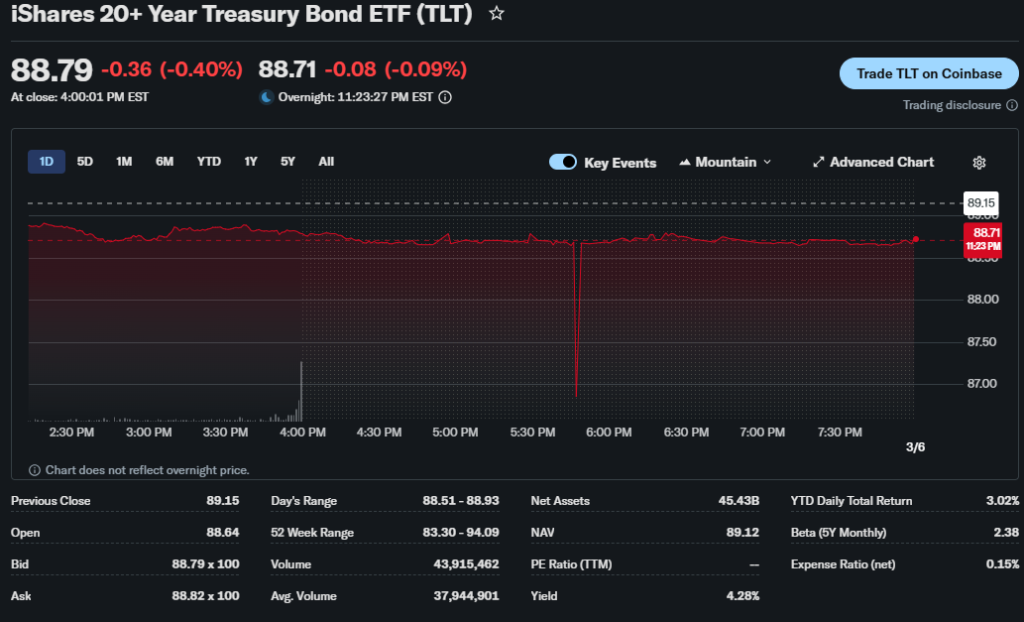
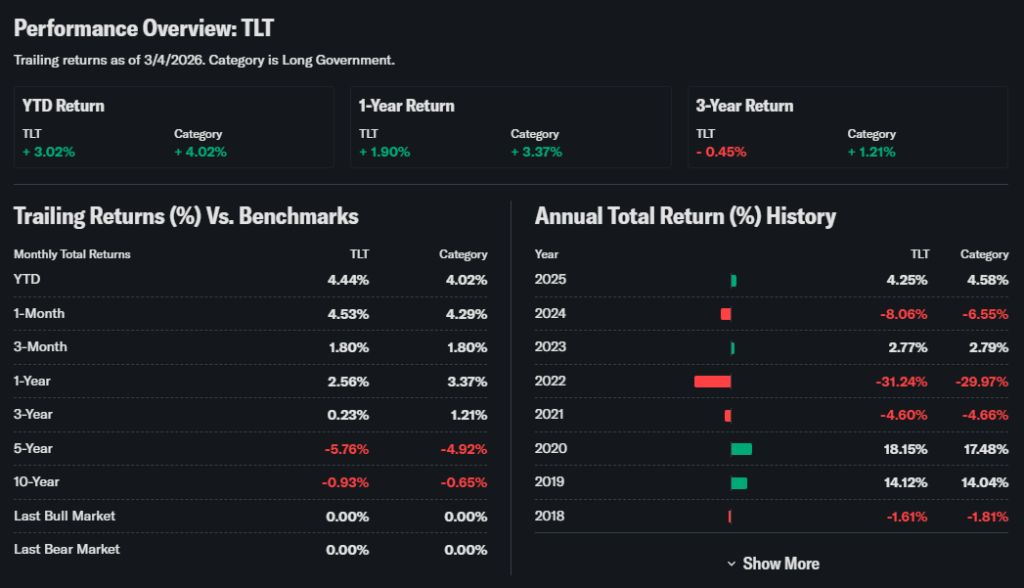
Five-day trend sideways around $89 amid steady yields. One-month up 3.14% on rate dip hopes.
Three-month gained 7.43%; six-month reflects volatility. Year-to-date flat at -0.27%.
52-week range $83.91 low to $94.09 high—current mid-recovery.
Sideways trend indicates balance for conservative bond investors awaiting Fed moves.
Technical Analysis
Support at $88.50 matches recent lows with buying interest. Resistance near $90, prior consolidation level.
RSI around 50 neutral—neither overbought above 70 nor oversold below 30.

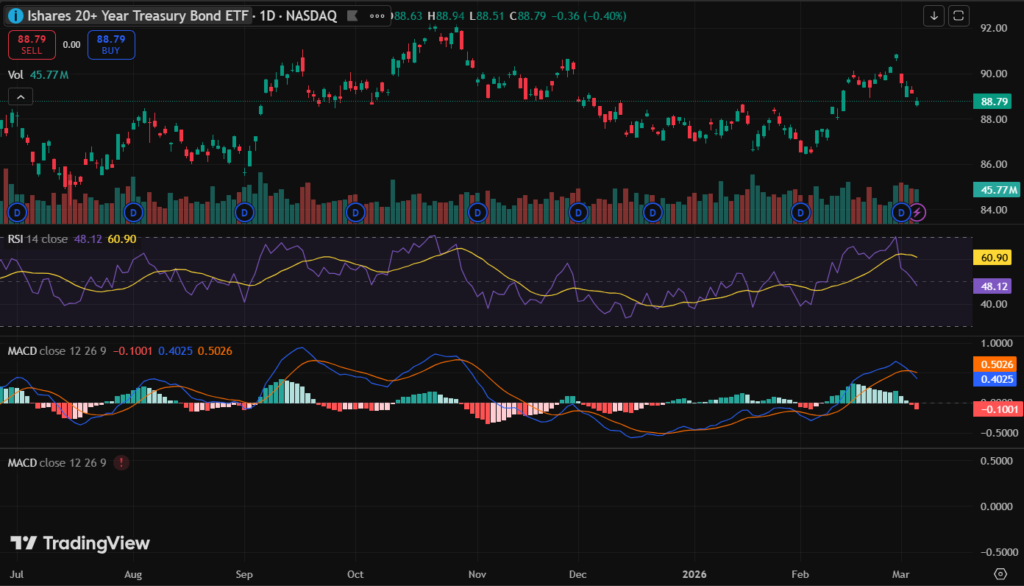
MACD flat near zero, signaling no strong directional bias currently.
50-day moving average $89.20 above 200-day $90.10—no clear cross pattern.
Volume steady at 40M shares daily, lacking conviction spikes.
Neutral indicators suggest patience; RSI guides TLT ETF technical analysis timing.
Analyst Ratings & Price Targets
Bond strategists neutral: 6 Holds, 4 Sells on long Treasuries.
Average target $92, high $96, low $85—3-8% upside if rates fall.
PIMCO holds steady; Goldman eyes cuts lifting bonds.
Cautious optimism means TLT ETF fits defensive portfolios.
Insider Activity
Treasury ETF managers show no direct trades; Fed policy drives flows.
Institutional buying up 5% in Q1 2026 per filings.
Trends reflect positioning for potential easing.
Steady activity implies measured confidence.
Valuation Analysis
TLT ETF yields 4.56% forward; duration 17.7 years sensitive to rates.
Price reflects 4.2% 30-year yield environment. No P/E as bond fund.

Portfolio backed by U.S. government—zero credit risk.
Versus shorter TIP, TLT offers higher yield but rate volatility.
Fairly valued at current yield curve levels.
Recent Earnings & Catalysts
No corporate earnings; February CPI cooled to 2.8% vs 3% expected.
Yields dipped post-data; Fed March pause priced 95%.
Catalysts: rate cuts starting June, debt ceiling resolution.
Lower inflation supported TLT ETF modest gains recently.
Bullish Case
Fed cuts 75bps by year-end lift prices 10%.
Flight-to-safety flows in volatility.
Long duration amplifies rate sensitivity positively.
Yield curve steepening favors long bonds.
Bearish Case
Hot inflation forces hikes, crushing prices 15%.
Trump deficits steepen curve against longs.
Equity rally pulls risk-on flows away.
Duration risk magnifies 1% yield rise to 18% loss.
Market Sentiment & Investor Psychology
Short interest low 1%; puts slightly lead calls.
Institutions hold 85%, steady positioning.
Retail favors stocks over bonds currently.
Neutral sentiment prevails for TLT ETF stability.
Short-Term Outlook
Neutral RSI eyes $90 resistance on soft data.
CPI reaction key; volume spikes signal direction.
Tight range $88-$90 likely pre-Fed meeting.
Medium to Long-Term Outlook
TLT excels as rates fall in slowdowns.
Treasury demand grows with deficits.
Unrivaled safety in fixed income.
Hold for diversification; accumulate below $88.
FAQ Section
Is TLT ETF a buy right now?
Defensive hold; buy on yield spikes.
What is the price target for TLT ETF?
$92 average if cuts materialize.
What are major risks for TLT ETF?
Rising rates, steepening curve.
TLT ETF forecast 2026?
$90-$98 range on Fed path.
TLT technical analysis key?
Neutral RSI, $88.50 support firm.
Suggestions
- Compare with SOXS intermediate ETF
- See Treasury yield curve forecast
- Read long bond duration guide
Conclusion
Hold TLT ETF for bond safety and yield. Fair pricing suits portfolios, but rate risks cap upside. Watch $88 support closely.
Disclaimer: This article is for informational purposes only and not financial advice.