

Tesla stock analysis: a balanced look at TSLA stock price, earnings, valuation, and 6–24 month outlook with key risk factors.
Introduction
Tesla, Inc. designs, manufactures, and sells electric vehicles and energy products, with a global focus on EVs, software, and charging networks. Investors are watching TSLA stock as the company scales production, navigates supply chain pressures, and pursues expansion into new markets and product lines. Broader tech and growth stock conditions, including higher interest rates and sector rotation, continue to influence Tesla’s valuation and investor sentiment.
Latest Stock Price & Trend
Tesla stock recently traded around the mid-$400s, reflecting a volatile session with intraday highs near the low-$420s and lows around the mid-$400s. Over the last day, performance was mixed as markets reeled from tech leadership shifts; over five trading days, TSLA showed modest gains in some sessions and pullbacks in others. The 1-month trend has experienced fluctuations tied to broader tech momentum and company-specific news. In the last three months, the stock has moved with notable volatility but demonstrated an overall trading range rather than a steady ascent or decline. The 6-month trend confirms ongoing volatility with several pullbacks and recoveries influenced by quarterly results and macro momentum. Year-to-date performance has been influenced by macro risk appetite and company execution updates. The 52-week high sits above the current price, with a 52-week low in the same general range, indicating a wide trading range and ongoing volatility. The overall trend direction remains mixed to bullish on certain days but cannot be characterized as a clear long-term uptrend given recent fluctuations. This means the stock can continue to swing with news cycles and investor appetite for growth amidst cycle debates.
Technical Analysis
Support and resistance levels: Support is the price floor where buyers tend to step in; resistance is the ceiling where sellers press back. These levels help estimate possible bounce points or breakouts.

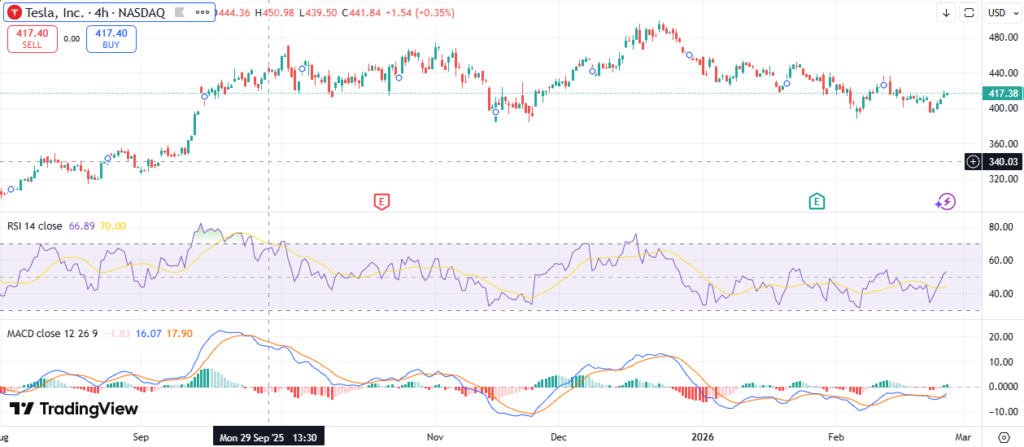
RSI reading: A measure of whether the stock is overbought or oversold. Readings near 70+ suggest overbought conditions; near 30 or below suggest oversold conditions.
MACD trend: The MACD line crossing above the signal line typically implies bullish momentum; crossing below implies bearish momentum.
50-day and 200-day moving averages: Short- and long-term trend indicators. A golden cross (50-day above 200-day) is often seen as bullish; a death cross (50-day below 200-day) as bearish.
Volume trends: Rising volume with price advances can confirm strength; shrinking volume during rallies may indicate caution.
What it means for beginners: These indicators collectively help judge whether the stock has room to rise, a risk of pullback, or a sideways pattern suitable for risk-managed positions.
Analyst Ratings & Price Targets
Buy/Hold/Sell mix: The consensus stance typically sits at a mix of Hold with some Buy ratings, reflecting ongoing debate about growth trajectory versus valuation.
Price targets: Analysts’ average targets sit in the mid- to upper-$300s range, with highs near the low-$400s and lows closer to the mid-$300s, illustrating a broad range of expectations.
Notable upgrades/downgrades: Periodic rating changes often align with quarterly results, product updates, or supply chain developments.
What sentiment means: A broader Hold or mixed rating signal suggests that the stock remains subject to both optimism about long-term dominance and caution about near-term risks.
Insider Activity
Recent insider buying: Occasional insider purchases can signal confidence in long-term strategy and product roadmap.
Recent insider selling: Occasional insider selling may reflect liquidity needs or rebalancing, not necessarily a negative view of the business.
Large transactions: Material insider moves can influence perception, but should be weighed with overall company performance and market conditions.
Takeaway: Mixed insider activity generally points to cautious optimism about long-term factors rather than a unanimous near-term conviction.
Valuation Analysis
Key indicators (typical ranges and interpretation):
Trailing P/E: Tesla often trades at a high multiple reflecting growth expectations; a very high P/E can imply elevated growth assumptions.


Forward P/E: Forward multiples depend on expected earnings; elevated levels may indicate high growth pricing or market skepticism about near-term results.
Price-to-Sales: A higher multiple can reflect strong revenue growth expectations rather than current profitability.
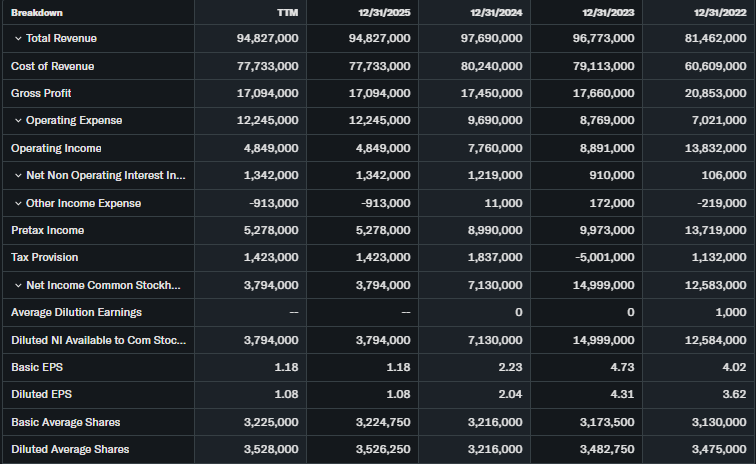
Revenue growth (YoY): Tesla has historically shown solid revenue growth driven by vehicle deliveries, energy products, and services.
EPS growth: Earnings growth can be volatile due to investment in capacity, pricing, and mix.
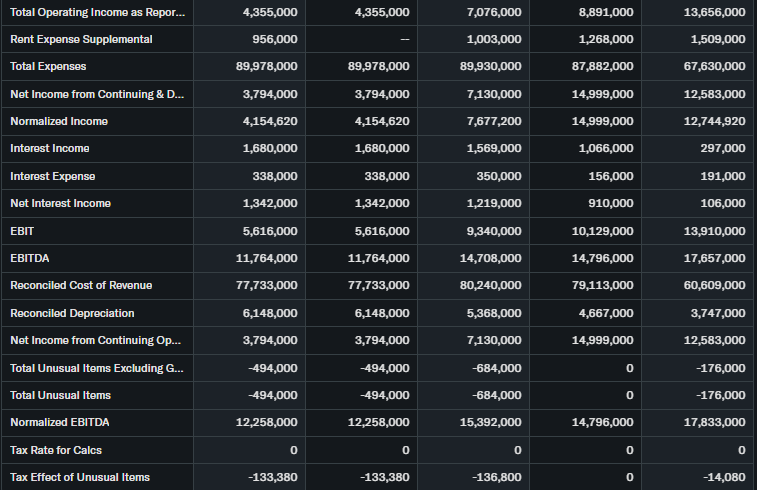
Free cash flow: Positive FCF supports capital allocation toward CapEx, share buybacks, or debt reduction; negative FCF may reflect expansion spending.
Debt & cash: The balance of cash and debt matters for flexibility, especially in a capital-intensive business.
Peer comparisons: In the EV/tech landscape, valuation can differ dramatically from peers like Zoom or traditional software names, depending on growth expectations and profitability profiles.
Valuation stance: Given high growth expectations but sizable investment needs, the stock can appear overvalued on traditional metrics, yet fairly valued or undervalued if long-term growth proves resilient and margins improve.
Recent Earnings & Catalysts
Latest quarterly results: Tesla’s results often beat or miss expectations on revenue, earnings, or margins, with big influences from vehicle mix, chip costs, and production efficiency.
Revenue vs expectations: Revenue growth is typically robust, though the pace can vary quarter to quarter.
EPS vs expectations: Earnings per share can be volatile due to strategic investments and cost dynamics.
Forward guidance: Guidance around production targets, margins, and energy storage demand shapes stock reaction.
Major catalysts: Product launches, new factories, expansions into energy storage, software updates, and AI-driven features are common catalysts.
Earnings impact: Strong results or guidance can lift TSLA, while missteps or supply chain concerns can dampen enthusiasm.
Bullish Case
Revenue growth catalysts: Expanding annual vehicle deliveries, higher gross margins from software and services, and energy storage demand.
Market demand: Global EV adoption accelerates, supported by charging infrastructure and favorable policy environments.
Technology advantages: Battery tech improvements, software-enabled features, and energy ecosystem integration.
Operational improvements: Scale benefits from new factories, lower per-unit costs, and improved supply chain resilience.
Bearish Case
Competition: Increasing EV competition from traditional automakers and new entrants could pressure market share.
Slowing growth: Macro headwinds or demand normalization after intense earlier growth could impact volumes.
Margin pressures: Raw material costs, price competition, or higher investment in capacity could compress margins.
Regulatory and policy risk: Changes in incentives or regulatory requirements could affect profitability.
Execution risk: Production delays or quality issues can weigh on earnings and sentiment.
Market Sentiment & Investor Psychology
Short interest: Elevated short interest can indicate caution or hedging activity among traders.
Options activity: A tilt toward calls can imply bullish sentiment; puts can signal hedging or caution.
Institutional ownership: Steady or rising institutional ownership can reinforce confidence; shifts may reflect risk appetite changes.
Retail behavior: Retail enthusiasm often fluctuates with headlines and headlines can amplify price swings.
Momentum vs value: Growth-heavy sentiment may favor TSLA in bull markets; value-minded investors may seek lower-valuation entry points.
Short-Term Outlook
Short-term view: Expect continued sensitivity to macro tech momentum and company news; technical setups may present select trading opportunities if volume returns.
Caution: News around supply chain, production milestones, or regulatory updates can create quick price moves.
Medium to Long-Term Outlook
Business model strength: Tesla’s diversified footprint in EVs, software, and energy storage supports multiple growth vectors.
Industry growth: Global EV adoption trends and energy storage demand provide a favorable tailwind.
Competitive position: Tesla’s brand, charging network, and software advantages create a defensible moat, but competitors are intensifying.
Financial health: Healthy cash flow and access to capital enable continued expansion, though debt levels warrant monitoring.
Risks: Execution risk, raw material cost volatility, and potential policy shifts are meaningful concerns.
Recommendation for long-term investors: Hold or consider gradual accumulation on weakness if you share long-term belief in EV and energy ecosystems.
FAQ Section
Is Tesla stock a buy right now? The answer depends on your risk tolerance, time horizon, and belief in long-term EV growth. A cautious Hold or gradual Buy on pullbacks may be prudent for many investors.
What is the price target for Tesla stock? Analysts’ price targets vary; current consensus ranges around the mid-to-upper $300s, with higher and lower estimates depending on growth scenarios and margins.
What are major risks for Tesla stock? Competitive pressure, margin compression, supply chain challenges, and policy changes are key risks to monitor.
Suggestions
Compare with Operdoor stock
See our Microsoft stock forecast
Read our tech sector valuation breakdown
Final Balanced Conclusion
Hold. Tesla remains a leading force in EVs and energy, but near-term volatility and high valuation require a measured approach. Long-term investors may find opportunities on weakness given expansion plans and software-driven monetization.
Disclaimer: This article is for informational purposes only and not financial advice