
SQQQ ETF analysis with price trends, technical signals, analyst context, risks, and outlook for investors watching inverse Nasdaq exposure.
Data as of April 20, 2026, 4:00 PM ET — last market close data used.
Introduction
The SQQQ ETF is the ProShares UltraPro Short QQQ fund. It aims to deliver three times the inverse of the daily performance of the Nasdaq-100, so it rises when big tech stocks fall. That makes the SQQQ ETF a trading tool, not a long-term stock-like investment.
Investors are focused on it now because it reacts sharply to tech volatility and weakness in growth stocks. This matters when interest rates, earnings expectations, or AI-led tech momentum move the Nasdaq-100. For that reason, the SQQQ ETF price tends to attract short-term traders more than long-term holders.
Etf Price & Trend
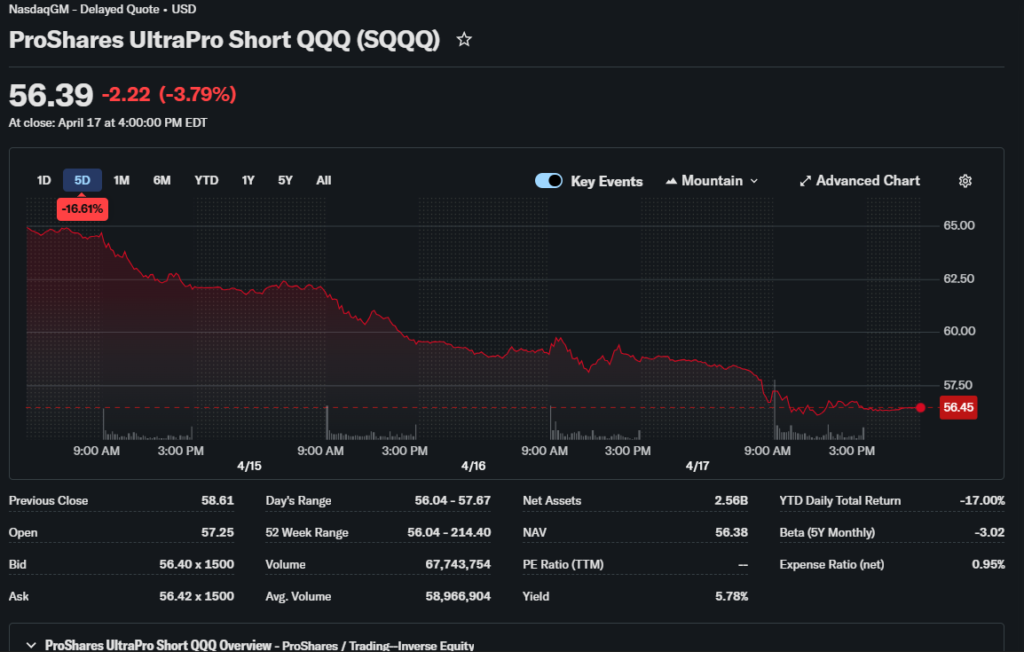
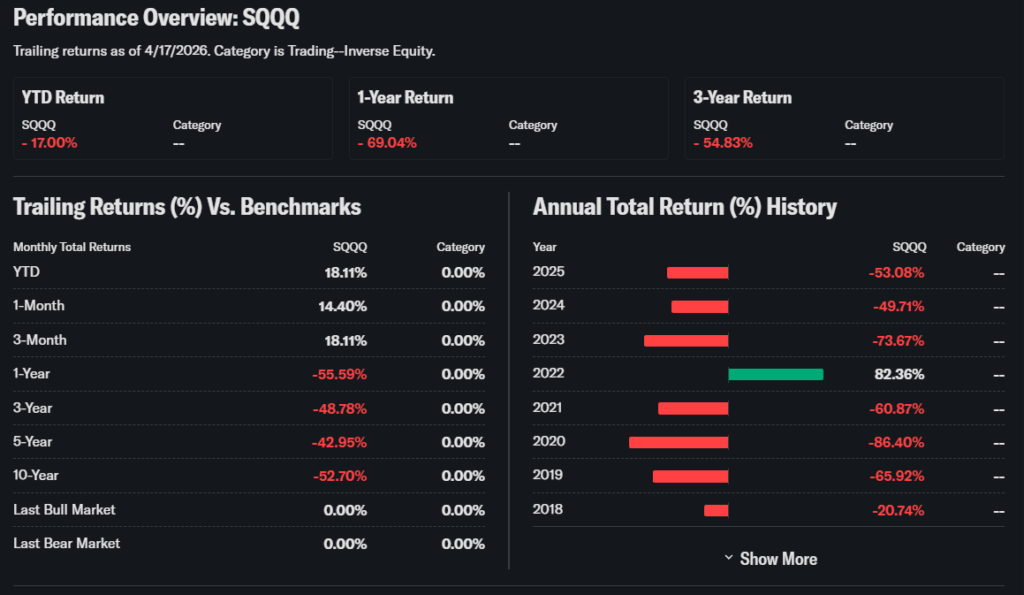
The latest quoted SQQQ ETF price in the sources reviewed was around $56.43 to $56.39 at the most recent close, with an intraday range of $56.04 to $58.38 on April 19, 2026. The fund’s 52-week range shown in the sources was $61.72 low and $289 high, which shows how aggressively this leveraged inverse ETF can swing. Its current level is far below the 52-week high, and that points to a bearish longer-term trend for the ETF itself.
On a shorter horizon, the SQQQ ETF price looked choppy rather than steady, which is normal for an inverse leveraged fund. A move like this usually means the Nasdaq-100 has been firm enough to pressure the ETF, but the fund still sees sharp bursts when tech weakens. For investors, that means the trend is best read as a short-term sentiment gauge, not a stable holding pattern.
Technical Analysis
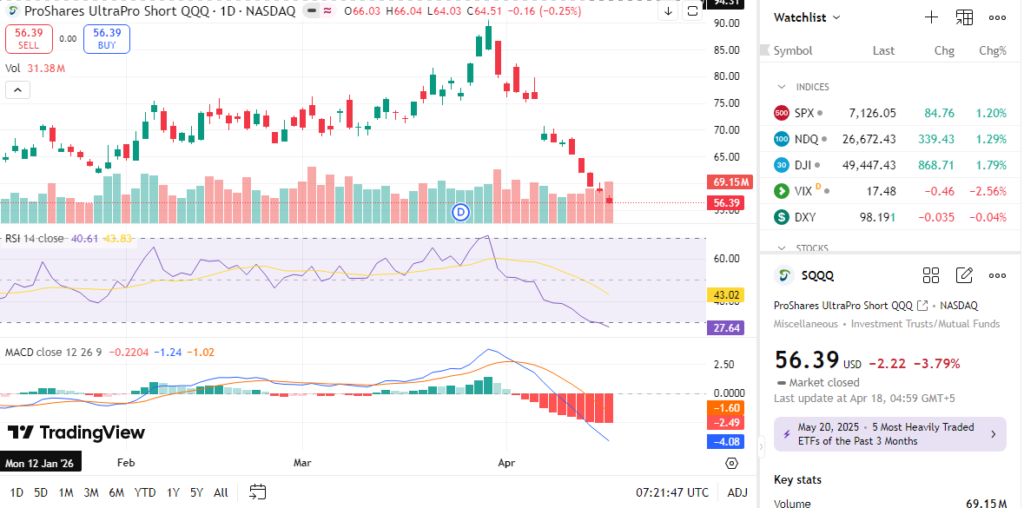
Support is the price area where buyers tend to step in. Resistance is where selling often appears. For the SQQQ ETF, the cited intraday low near $56.04 can act as near-term support, while the intraday high near $58.38 can serve as near-term resistance based on the latest session data.
RSI measures whether a market is stretched on the upside or downside. The available technical reading showed RSI(14) at 34.387, which is close to oversold territory but not fully there yet. MACD was not directly listed in the source, but the broader technical dashboard showed a Strong Sell bias across moving averages, which leans bearish.
The 50-day and 200-day moving averages matter because they help show medium and long trend direction. The available technical screen showed weak moving-average signals across the board, with 0 Buy signals and 12 Sell signals. That usually means the SQQQ ETF technical analysis is still negative, even if short-term rebounds can happen quick.
A golden cross happens when the 50-day average rises above the 200-day average, which often suggests improving momentum. A death cross is the opposite and usually signals weakness. The sources did not show a fresh golden cross, and the overall technical picture remained weak.
Volume also matters because strong moves with heavy trading are more meaningful. The fund’s average daily volume was very high, around 49.89 million to 58.81 million shares, which confirms that the SQQQ ETF is highly active and liquid. That liquidity helps traders enter and exit quickly, but it does not remove the ETF’s built-in risk.
Analyst Ratings & Price Targets
Traditional analyst ratings and price targets are not very useful for the SQQQ ETF because it is a leveraged inverse fund, not an operating company. The usual Buy, Hold, and Sell framework is designed for businesses with revenue, earnings, and growth forecasts. For SQQQ, the more relevant input is the direction of the Nasdaq-100 and the market’s risk appetite.
There were no meaningful Wall Street price targets for the fund in the reviewed sources. That is expected, because the SQQQ ETF price is designed to track an inverse daily index move, not company fundamentals. Investors should treat any “target” as a view on market direction, not a valuation estimate.
Insider Activity
Insider activity does not really apply to the SQQQ ETF in the same way it does for a company. The fund is managed by ProShares, but there is no normal insider buying or selling signal to interpret like a stock’s executive trades. So the usual SQQQ ETF earnings or insider-watch framework is not relevant here.
That said, fund flow data can act as a sentiment proxy. TradingView noted about $3.43 billion in one-year fund flows, which shows strong trader interest. Large flow activity usually reflects active positioning, not insider conviction.
Valuation Analysis
Valuation ratios such as trailing P/E, forward P/E, and price-to-sales do not fit the SQQQ ETF well because it is not an operating company. The source screens even showed P/E ratio: 0 or blank-like fields, which is normal for this structure. Free cash flow, revenue growth, and EPS growth are also not meaningful for this ETF itself.
Instead, the useful comparison is structural. The SQQQ ETF is a leveraged bearish exposure tool, while companies like Microsoft or Zoom are businesses with earnings, cash flow, and growth profiles. So calling SQQQ undervalued or overvalued would be misleading; it is better described as a tactical instrument whose price depends on Nasdaq-100 direction and daily compounding effects.
Recent Earnings & Catalysts
The SQQQ ETF does not have quarterly earnings in the corporate sense, so “SQQQ ETF earnings” is not a standard metric. There are no revenue surprises or EPS beats for the fund itself. Instead, the main catalyst is market movement in the Nasdaq-100 and the behavior of large-cap tech shares.
Any sharp move in the SQQQ ETF usually comes from macro catalysts. These include rate expectations, inflation data, earnings from big tech companies, and shifts in risk sentiment. In practical terms, when growth stocks sell off, the SQQQ ETF often benefits quickly, but those gains can fade just as fast if the market stabilizes.
Bullish Case
The bullish case for the SQQQ ETF is simple. If the Nasdaq-100 weakens, the fund can rise sharply because of its inverse leverage. That can make it useful during risk-off periods, earnings selloffs, or broad tech corrections.
It also has strong liquidity and active trading volume, which helps short-term traders manage entries and exits. For tactical investors, the SQQQ ETF price can offer fast exposure to downside moves without using options. The key advantage is speed, not long-term compounding.
Bearish Case
The main risk is decay from daily rebalancing. Because the fund seeks 300% inverse daily exposure, holding it for long periods can produce results that differ sharply from the simple opposite of the Nasdaq-100. That makes it a poor fit for buy-and-hold investor.
Another risk is that strong tech rallies can crush the SQQQ ETF quickly. Even when the SQQQ ETF forecast looks attractive for a short stretch, timing has to be precise. If the market stays resilient, the ETF can lose value fast.
Market Sentiment & Psychology
Sentiment around SQQQ is usually defensive or tactical. High fund flows and heavy volume suggest active trading interest rather than patient accumulation. The technical setup also leaned bearish, which supports the idea that traders were still cautious on the fund itself.
Short interest is not very meaningful here because the product is already designed for bearish exposure. Options activity can matter, but the reviewed sources did not provide a clean calls-versus-puts split. Overall, sentiment looks neutral to fearful, with traders using the ETF mainly as a hedge or short-term bet.
Short-Term Outlook
Over the next days and weeks, the SQQQ ETF will likely continue to trade in sharp swings. The technical tone remains weak, but the high liquidity means sudden reversals are always possible. If the Nasdaq-100 weakens, the ETF can bounce hard; if tech firms stay firm, the ETF may remain under pressure.
For short-term traders, the best approach is to watch support, resistance, and volume together. The SQQQ ETF technical analysis suggests a cautious stance rather than a confident trend-following setup.
Medium to Long-Term Outlook
Over 6 to 24 months, the SQQQ ETF is best understood as a trading vehicle, not a long-term core holding. Its structure makes it sensitive to time decay and daily compounding. That means even a correct bearish view can still lose money if held too long.
Long-term investors should generally watch rather than accumulate. The ETF makes sense mainly for hedging or short-term tactical trades tied to tech weakness. Its structure is effective, but only for disciplined, time-sensitive use.
FAQ
Is SQQQ ETF a buy right now?
It can fit short-term bearish trades, but it is not a good long-term buy for most investors.
What is the price target for SQQQ ETF?
There is no standard analyst price target, because SQQQ follows inverse daily Nasdaq-100 performance.
What are the biggest risks for SQQQ ETF?
The biggest risks are leverage decay, rapid losses during tech rallies, and poor long-term compounding.
What is SQQQ ETF forecast?
The forecast depends mainly on the Nasdaq-100 and market risk sentiment, not company earnings.
Internal Links
- Compare with QQQ ETF analysis.
- Read our Nasdaq-100 market outlook.
- See our leveraged ETF risk guide.
Conclusion
The SQQQ ETF is a powerful but specialized tool. It can work well for short-term bearish positions, but it is not suitable for most long-term investors. Given the weak technical setup and inverse leveraged structure, the most balanced rating is Watchlist.
Disclaimer: This article is for informational purposes only and not financial advice.