

SPY Technical Analysis: Trend, Levels & Outlook March 2026
SPDR S&P 500 ETF Trust (SPY) is one of the largest and most widely traded exchange-traded funds in the world. The ETF tracks the S&P 500 Index, which represents 500 of the largest publicly traded companies in the United States. Because of its size and liquidity, SPY is often used by traders and investors as a benchmark for the overall U.S. stock market.
In March 2026, SPY remains a key focus for market participants as investors monitor economic growth, inflation data, and central bank policy decisions. Movements in SPY often reflect the broader direction of the stock market, making technical analysis of this ETF particularly useful for traders seeking insight into market sentiment.
This article examines SPY’s current trend, key support and resistance levels, and indicators such as RSI, MACD, and volume to better understand the ETF’s technical outlook.

Current Price Trend in March 2026
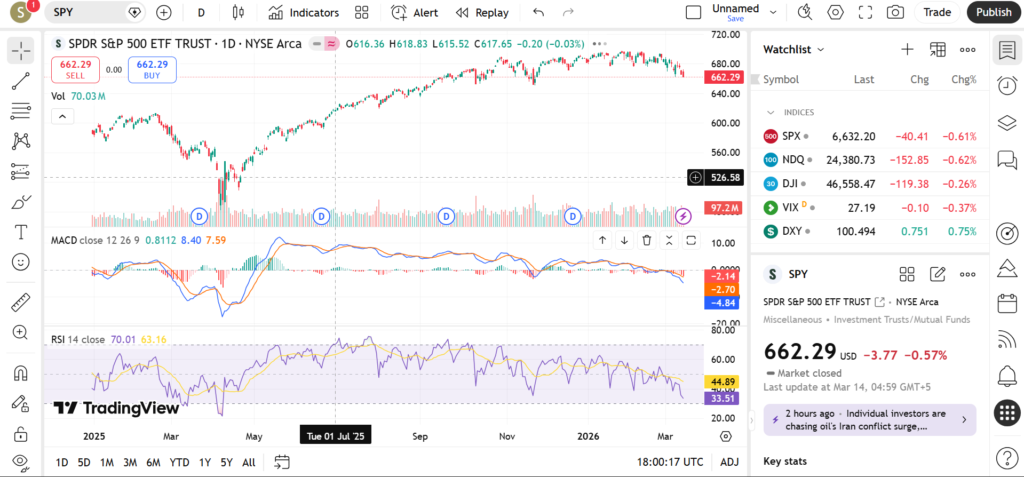
SPY has been trading in a gradual upward trend over recent months, reflecting continued resilience in large-cap U.S. equities. While periodic pullbacks have occurred, the ETF has generally maintained a structure of higher highs and higher lows.
The 20-day moving average has acted as short-term dynamic support during recent consolidations. Price has occasionally dipped below it temporarily but often recovers quickly.
The 50-day moving average continues to trend upward, suggesting that the medium-term trend remains positive.
Meanwhile, the 200-day moving average remains well below current price levels, reinforcing the long-term bullish structure that has been in place for much of the past year.
Recent price action suggests that SPY may be entering a sideways consolidation phase near recent highs, which often occurs after extended rallies.
Key Support and Resistance Levels
Important Support Levels
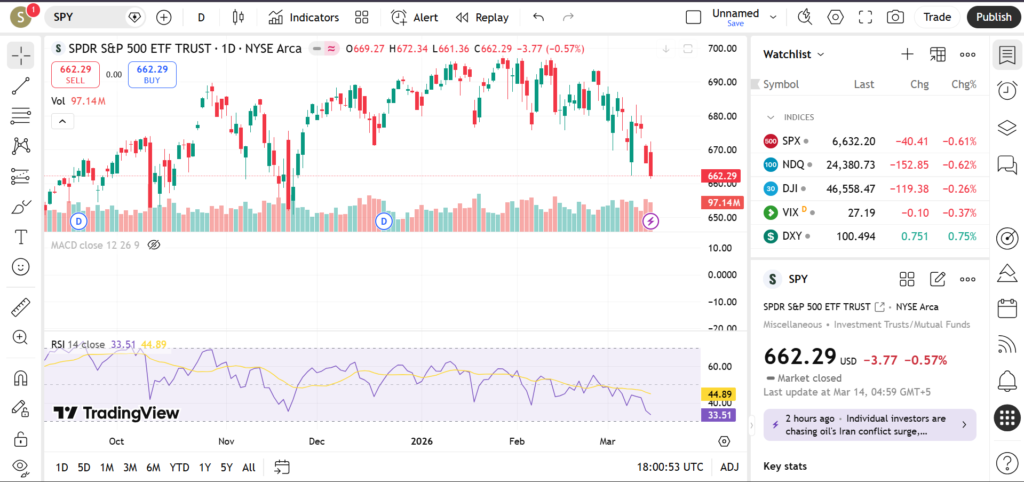
The first support area lies near the recent swing low created during the latest pullback.
Another important support level exists near the 50-day moving average, which has historically acted as a strong support zone.
A deeper support region may appear near the 200-day moving average, which represents the long-term trend floor.

Important Resistance Levels
The first resistance level appears near the recent swing high formed during the latest rally.
Another resistance zone exists near previous all-time highs, where price previously encountered selling pressure.
A strong breakout above these levels could signal renewed bullish momentum for the broader market.
Indicators – RSI, MACD, Volume
RSI
RSI for SPY has been fluctuating in the upper neutral range, suggesting moderate bullish momentum without reaching extreme overbought conditions.
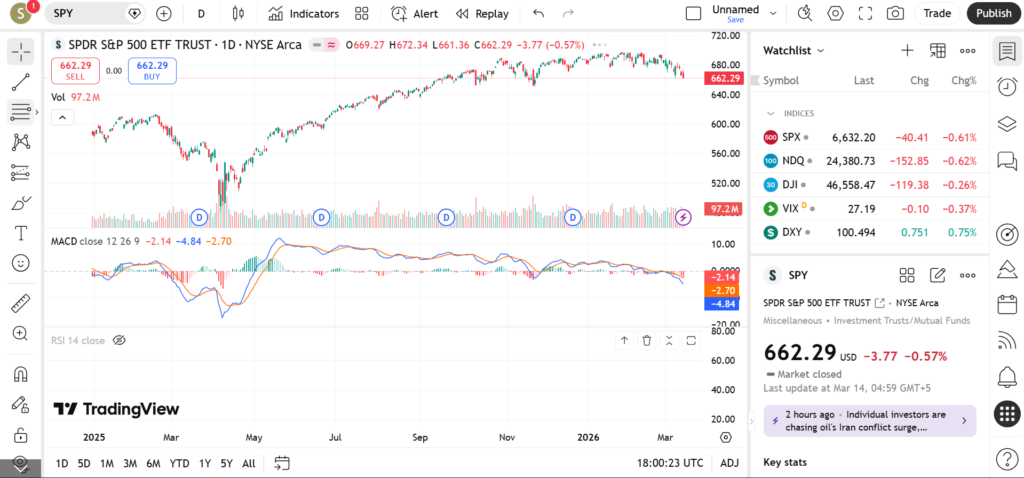
MACD
MACD continues to show positive momentum, though the indicator has started flattening slightly, which may indicate slowing trend strength.
Volume
Volume has remained relatively stable, with occasional spikes during major market moves driven by economic news.

Short-Term Outlook for SPY in March 2026
The overall technical structure for SPY remains constructive, supported by rising moving averages and higher lows. However, consolidation near recent highs suggests that the market may pause before its next directional move.
What traders are watching
- Breakout above recent highs
- Support near the 50-day moving average
- Economic data and Federal Reserve signals
- Sector rotation within the S&P 500
- Volume confirmation during breakouts
Risks and Important Notes
Technical levels may fail due to unexpected macroeconomic events, geopolitical developments, or major corporate earnings surprises.
This analysis is for educational purposes only and should not be interpreted as financial advice.
For additional insights, readers may explore analysis of QQQ, DIA, and sector-specific ETFs to gain a broader view of market trends.