SOXS Technical Analysis: Trend, Levels & Outlook March 2026
Direxion Daily Semiconductor Bear 3X Shares (SOXS) is a leveraged exchange-traded fund designed to deliver three times the inverse daily performance of the semiconductor sector, typically tracking the opposite movement of major semiconductor indices. Because it is a bearish leveraged ETF, SOXS rises when semiconductor stocks decline and falls when the sector rallies.
Semiconductor stocks play a crucial role in the technology industry, powering everything from artificial intelligence systems to consumer electronics. As a result, SOXS often becomes active during periods when investors anticipate weakness in the semiconductor sector. In March 2026, traders are watching this ETF closely as chip stocks experience volatility due to global demand shifts, technology spending cycles, and macroeconomic factors.
This article examines the current technical trend of SOXS, important support and resistance levels, the signals coming from indicators like RSI and MACD, and the short-term outlook for March 2026.
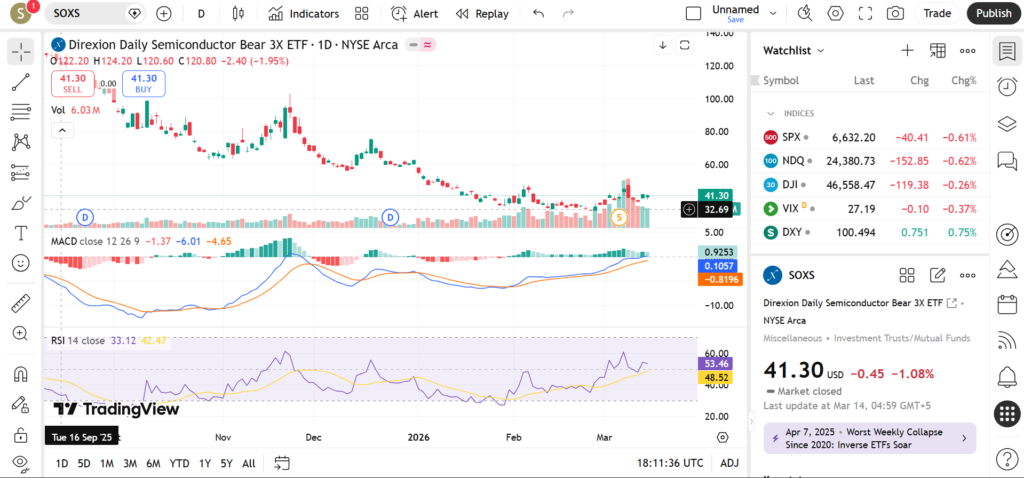
Current Price Trend in March 2026
SOXS has been displaying volatile price swings typical of leveraged inverse ETFs. Because the semiconductor sector has experienced alternating periods of strength and weakness, SOXS has reacted with rapid spikes followed by sharp pullbacks.
In recent weeks, the ETF has traded within a range following earlier volatility spikes. When semiconductor stocks rally strongly, SOXS typically declines quickly due to its inverse structure. Conversely, during sudden tech sell-offs, the ETF tends to surge higher.
The 20-day moving average has acted as a near-term momentum indicator. When price breaks above this average during semiconductor weakness, it often signals growing bearish sentiment toward the sector.
The 50-day moving average has occasionally served as resistance following volatility spikes. If price remains below this level, it may suggest that bearish momentum in the semiconductor sector is fading.
Although leveraged ETFs are typically used for short-term trading, the 200-day moving average still provides context for broader trends in semiconductor market cycles.
Recent price action shows lower highs forming after volatility spikes, indicating that bearish momentum may be weakening unless new catalysts trigger a semiconductor sell-off.
Key Support and Resistance Levels
Support levels for SOXS include:
- Recent volatility low: The lowest point reached after the most recent decline.
- Short-term consolidation zone: A region where price stabilized after a previous drop.
- Round-number support levels: Psychological price areas where traders often place orders.
Resistance levels include:
- Recent volatility spike high: The highest level reached during the latest semiconductor sell-off.
- 50-day moving average: Acting as dynamic resistance during bearish ETF pullbacks.
- Prior breakout level: A level that previously triggered rapid upside moves in SOXS.
If SOXS breaks above its recent spike highs, it may indicate increasing bearish pressure in the semiconductor sector. However, if the ETF falls below its consolidation support, it might suggest continued strength in chip stocks.
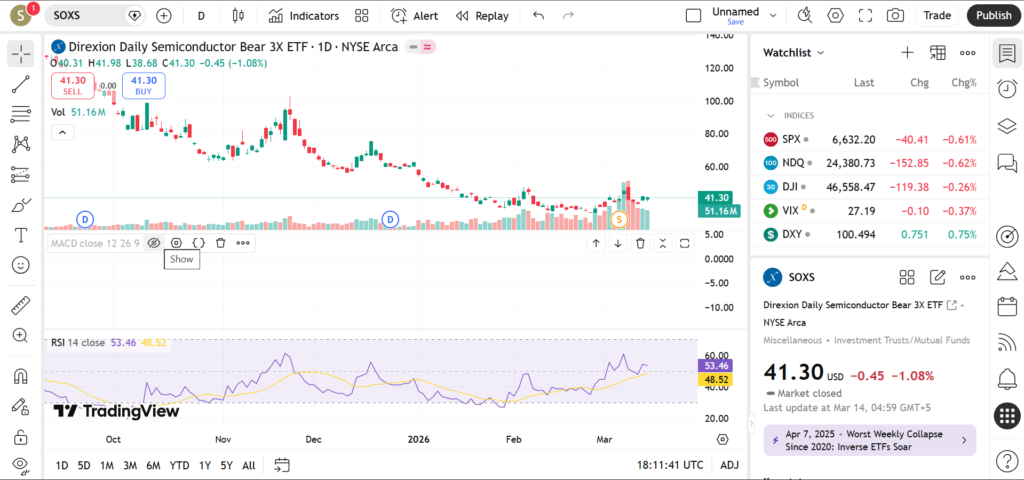
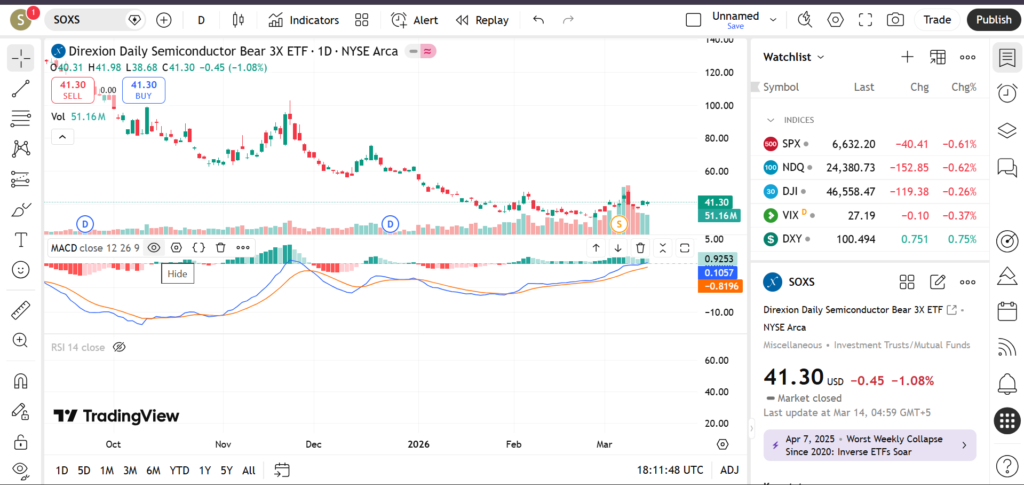
Indicators – RSI, MACD, Volume
The RSI indicator currently sits near neutral territory. Because SOXS can move quickly during tech sector sell-offs, RSI may rapidly move into overbought territory during volatility spikes.
The MACD indicator shows fluctuating momentum signals, reflecting the rapidly changing sentiment in semiconductor stocks. Short-term crossovers often appear as traders react to news affecting the chip industry.
Volume spikes frequently occur during sudden price movements in SOXS. These spikes usually correspond with sharp declines in semiconductor stocks, which can trigger hedging activity among traders.
Short-Term Outlook for SOXS in March 2026
The short-term outlook for SOXS depends largely on the performance of semiconductor stocks and the broader technology sector. If chip companies experience renewed selling pressure, SOXS could see another volatility spike.
What traders are watching:
- Weakness in major semiconductor stocks
- Technology sector rotation
- Economic data affecting tech spending
- Global semiconductor demand forecasts
- Market reactions to AI and chip industry developments
Risks and Important Notes
Leveraged inverse ETFs like SOXS carry significant risk because they reset daily and amplify market movements. Holding these instruments for extended periods can lead to performance differences compared with the underlying index.
Unexpected developments in technology markets, global supply chains, or economic policy could quickly invalidate technical patterns.
This analysis is for educational purposes only and should not be interpreted as financial advice. Traders should consider risk management strategies when trading leveraged ETFs.
For additional market insight, readers may also review technical analysis of semiconductor sector ETFs, technology index funds, and volatility-related instruments.