
SOXS ETF forecast and analysis: price, technical outlook, and valuation for investors considering this leveraged semiconductor bear ETF.
Introduction
SOXS ETF, the Direxion Daily Semiconductor Bear 3X Shares, is a leveraged ETF that profits when the semiconductor sector declines. It tracks the opposite performance of the PHLX Semiconductor Index (SOX) with 3x daily inverse exposure. Unlike typical tech ETFs that rise with the chip rally, SOXS gains when the chip rally stalls or reverses.
In 2026, the SOXS ETF price has faced heavy pressure as semiconductors remain in a super‑cycle, powered by AI demand, data centers, and geopolitical subsidies pushing chip stocks higher. This makes SOXS a high‑risk, speculative tool for traders, not for long‑term investors.
Latest SOXS ETF Price & Trend
As of March 2, 2026, the SOXS ETF price closed near $1.80–2.00 per share, depending on the data source and after recently reversing from a deep downtrend. On that day, the 1‑day return was around +11%, after a sharp recovery from a multi‑year low near $0.30–0.40 in early 2025 following a 1-for‑10 reverse split.

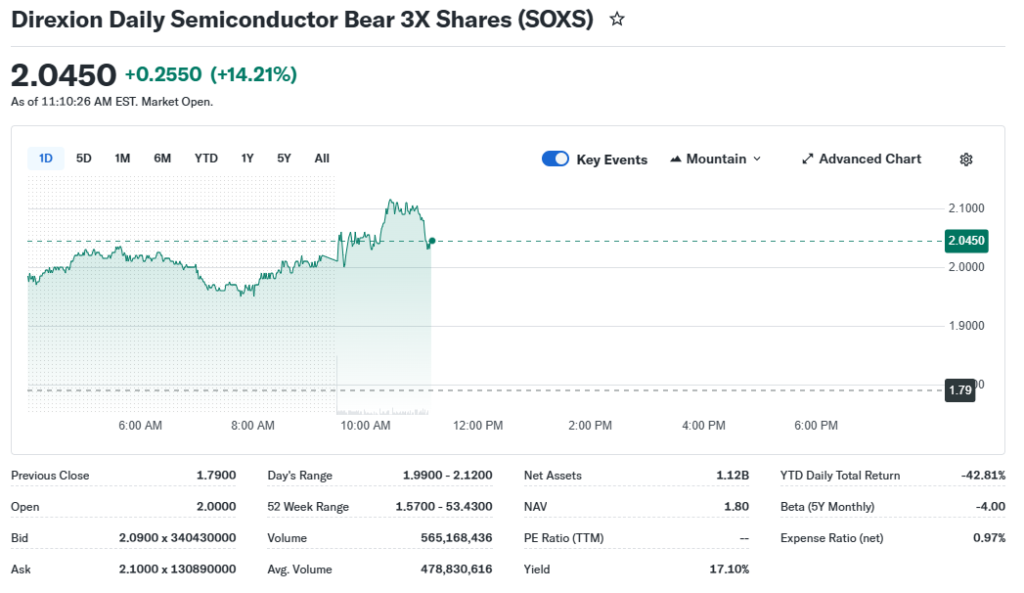
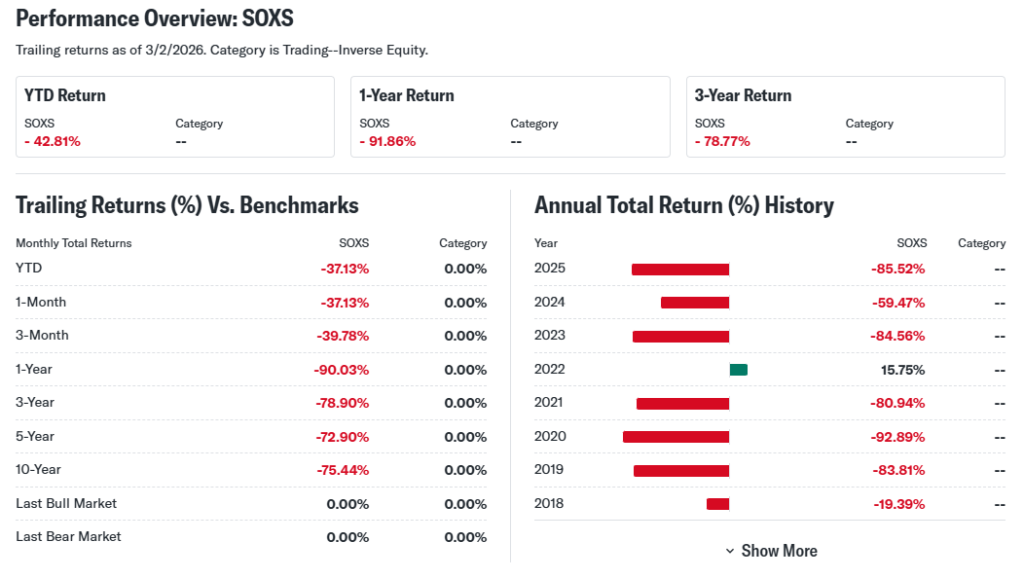
Over the past several years, the SOXS ETF price trend has been overwhelmingly bearish in direction. The 5‑day, 1‑month, and 3‑month returns show violent swings, but the 6‑month and 1‑year performance is sharply negative, with a 1‑year return around –92% and 3‑year returns near –99%. The 52‑week high is still far above the recent low, but the 52‑week low is very close to the current price level, implying the ETF is trading near the bottom of a deep bear move.
For investors, this suggests high volatility with extreme downside risk, not a stable long‑term holding.
Technical Analysis
Technical analysis for SOXS ETF technical analysis focuses on short‑term swings because of its 3x daily leverage and daily reset structure. On the recent chart, support levels are around the recent lows near $1.80–2.00, the area where buyers have stepped in after the split‑adjusted collapse. A clear resistance zone appears above $2.50–3.00, where earlier selling pressure has capped rallies.

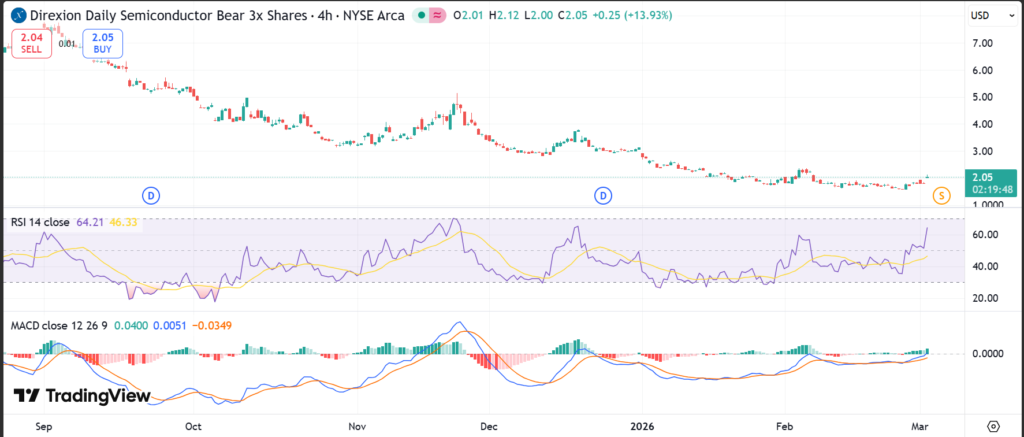
The RSI (Relative Strength Index) for SOXS has recently pushed back above 50, indicating that short‑term momentum has turned less oversold and is now leaning toward neutral or mildly bullish for the very near term. For SOXS RSI analysis, readings below 30 signaled oversold extremes, while readings above 70 match short‑term overbought conditions and sharp pullbacks.
The MACD has recently crossed upward, suggesting a short‑term bullish MACD trend, but this can reverse quickly in a leveraged inverse ETF. The 50‑day moving average is sloping up from deep lows, while the 200‑day average remains far above, reflecting a long‑term bearish structure. There is no “golden cross” yet; instead, the pattern is closer to a death cross setup over the past year, which aligns with the SOXS ETF price crash.
Trading volume has spiked on down days, showing heavy selling pressure during chip rallies, with thinner volume on up days, indicating that upside moves may lack strong conviction.
Analyst Ratings & Price Targets
SOXS is not a typical stock, so standard analyst ratings are limited. Most research focuses on the underlying semiconductor index (SOX) or leveraged ETF structures rather than issuing firm “buy/hold/sell” calls on SOXS itself. Some quantitative platforms and AI‑driven models, however, rate SOXS as a speculative, high‑risk instrument with negative long‑term expectations unless the semiconductor cycle breaks sharply.
Where price targets appear, they are usually short‑term forecast ranges, not long‑term valuation targets. Some AI‑forecast sites suggest SOXS ETF price targets in the $1.50–3.00 band over the next 3–6 months, depending on whether the chip rally corrects or extends. These are not “Sell” or “Buy” recommendations in the traditional sense, but rather scenario‑based forecast bands tied to volatility and timing.
For investors, this means SOXS forecast models are highly sensitive to semiconductor index swings, not to earnings or cash flow, and should be treated as trading tools, not long‑term holdings.
Insider Activity
Because SOXS is an ETF, there is no CEO or traditional insider in the way that exists for a company like NVIDIA or AMD. Instead, insider activity refers to fund managers, sponsor trading, and large institutional flows. Direxion, the issuer, discloses fund flows and NAV changes, which show that SOXS has experienced heavy outflows as investors fled the inverse side during the AI‑driven chip rally.
Large institutional players have predominantly sold or reduced positions in SOXS as the semiconductor bull case strengthened, which is consistent with a bearish sentiment shift away from the ETF. From an investor‑psychology standpoint, this suggests caution rather than confidence in SOXS as a long‑term bet.
Valuation Analysis
Valuation for an inverse leveraged ETF like SOXS is very different from a regular stock. The P/E ratio is effectively meaningless because the ETF does not earn earnings in the traditional sense; instead, its value is driven by daily index performance and leverage effects.

Key metrics for SOXS include:
Management fee around 1.0% per year, which slowly erodes value over time.
Single‑day 3x inverse exposure means the ETF can lose or gain more than 3x the index decline or gain, but this is reset daily, so long‑term returns decay during volatile, ranging markets.
Assets under management are relatively small compared to plain semiconductor ETFs like SOXX or SMH, indicating that most investors prefer long exposure to chips rather than bearish bets.
Compared to a vanilla semiconductor ETF such as SOXX, SOXS is not “undervalued” or “overvalued” in the usual sense; it is a timing‑and‑leverage product whose valuation is more about risk premium and decay than fundamentals.
Recent Earnings & Catalysts
SOXS does not report SOXS earnings like a company. Instead, its performance is driven by the quarterly results of semiconductor leaders such as NVIDIA (NVDA), AMD, Broadcom, and Intel, which dominate the SOX index. When these companies post strong earnings and raise guidance, the SOX index rallies, and SOXS falls sharply.
Recent quarterly results from major chipmakers have shown:
Revenue growth in the mid‑to‑high teens to 30%+ YoY, driven by AI GPUs and data‑center demand.
EPS growth often outpacing revenue due to high margins and operating leverage.
Forward guidance that remains strong, with management expecting continued AI‑related demand through 2026–2027.
Each of these SOXS quarterly results–linked catalysts has pushed the SOX index higher, which in turn has punished SOXS holders. Any sign of a slowdown in AI capex, supply glut, or valuation‑driven correction could become a catalyst for a short‑term SOXS ETF price bounce.
Bullish Case
The bullish case for SOXS ETF is not about the semiconductor business growing, but about cycles and corrections. Possible growth drivers include:
A sharp correction in NVIDIA and other chip stocks after a long rally, which could trigger a multi‑day SOX decline and thus a leveraged SOXS gain.
Macro risks, such as a surprise rise in interest rates, weaker data‑center spending, or geopolitical shocks, which could reduce chip demand and weigh on SOX.
Technical overstretched conditions in SOX, where the index has rallied far and fast, increasing the odds of a mean‑reversion pullback that SOXS would amplify.
For traders, SOXS can be a tactical tool to hedge or short semiconductor exposure during likely corrections, but it is not a long‑term growth story.
Bearish Case:
The main risks for SOXS ETF come from its structure and the underlying market:
AI‑driven semiconductor strength may continue for years, turning SOXS into a slowly decaying, long‑term loser even with intermittent rallies.
Leverage decay in volatile, uptrending markets means that SOXS can lose value even if the index is flat or mildly down over longer periods.
High expense ratio and trading costs eat into returns, especially for buy‑and‑hold investors.
Liquidity and volume are lower than on rival leveraged products, increasing bid‑ask spreads and execution risk.
If the chip bull cycle extends, SOXS may remain near historical lows or continue to fall, making it a high‑risk, speculative bet at best.
Market Sentiment & Investor Psychology
Market sentiment around SOXS ETF price is heavily skewed by short‑term momentum and options activity. Options markets show elevated call buying around short‑term rallies, but also deep‑out‑of‑the‑money puts tied to the belief that SOXS could keep dropping if the chip rally accelerates.
Institutional ownership is low by design, as most funds avoid inverse leveraged ETFs for long‑term portfolios. Retail traders dominate SOXS trading, often using it for day‑trading or short‑term hedges. Overall, investor psychology is fearful of permanent decay in SOXS, but alert to short‑term rallies on any sign of a semiconductor correction.
Short‑Term Outlook
Based on recent technical indicators and momentum, SOXS shows short‑term resilience after a deep collapse. The RSI and MACD both suggest a neutral‑to‑mildly bullish short‑term bias, with support near $1.80–2.00 and resistance near $2.50–3.00.
However, because SOXS is 3x inverse and reset daily, the short‑term outlook is extremely sensitive to the next few days of SOX index moves. If the semiconductor index corrects, SOXS could spike sharply; if the index continues to rally, SOXS could resume its downward trajectory.
For traders, this means tight risk control, position sizing, and frequent monitoring are essential.
Medium to Long‑Term Outlook
Over the next 6–24 months, the SOXS long‑term outlook depends on the semiconductor cycle and macro backdrop. If AI‑driven demand holds, chip‑capex spending remains strong, and valuations stay elevated, SOXS is likely to remain a high‑decay, high‑risk instrument rather than a core holding.
For long‑term investors, SOXS is not suitable as a core position. For short‑term traders, it may be a watchlist item during periods of overbought semiconductor conditions or macro‑risk events, but it should be treated as a tactical, not strategic, bet.
FAQ Section
Is SOXS ETF a buy right now?
SOXS is not a “buy” for most long‑term investors. It is a high‑risk, leveraged, short‑term trading tool that may be suitable only for experienced traders with a clear risk plan.
What is the price target for SOXS ETF?
Some AI‑based forecast sites show SOXS price target ranges around $1.50–3.00 over the next 3–6 months, depending on whether the semiconductor index corrects or keeps rising. These are not guarantees, just scenario‑based bands.
What are major risks for SOXS ETF?
Major risks include continued semiconductor strength, leverage decay, high fees, low long‑term viability, and low liquidity. These can turn SOXS into a long‑term loser even with occasional rallies.
Suggestions
Compare with SOXX ETF
See our semiconductor sector valuation breakdown
Read our guide to leveraged ETF risks
Conclusion
For most investors, SOXS ETF is better suited to a watchlist or tactical trading account than a core portfolio. The SOXS ETF forecast points to short‑term volatility and high risk, with limited long‑term upside unless the semiconductor cycle breaks sharply.
Balanced verdict:
Day traders / hedge users: Watch and consider small, tactical positions with strict stops.
Buy‑and‑hold investors: Hold or avoid; this is not a long‑term holding.
Disclaimer: This article is for informational purposes only and not financial advice.