
SOXS ETF forecast 2026: Analyze Direxion Daily Semiconductor Bear 3X price trends, technicals, and risks amid semiconductor rally. Is SOXS ETF a buy now?
Introduction
The SOXS ETF seeks daily investment results of 300% the inverse of the PHLX Semiconductor Sector Index. It thrives when chip stocks fall. Investors eye SOXS ETF now as AI demand drives semiconductors higher in 2026.
Broader market conditions favor tech bulls. Tariff talks under President Trump pressure supply chains. Yet Nvidia leads gains, hurting SOXS ETF price.
Latest ETF Price & Trend
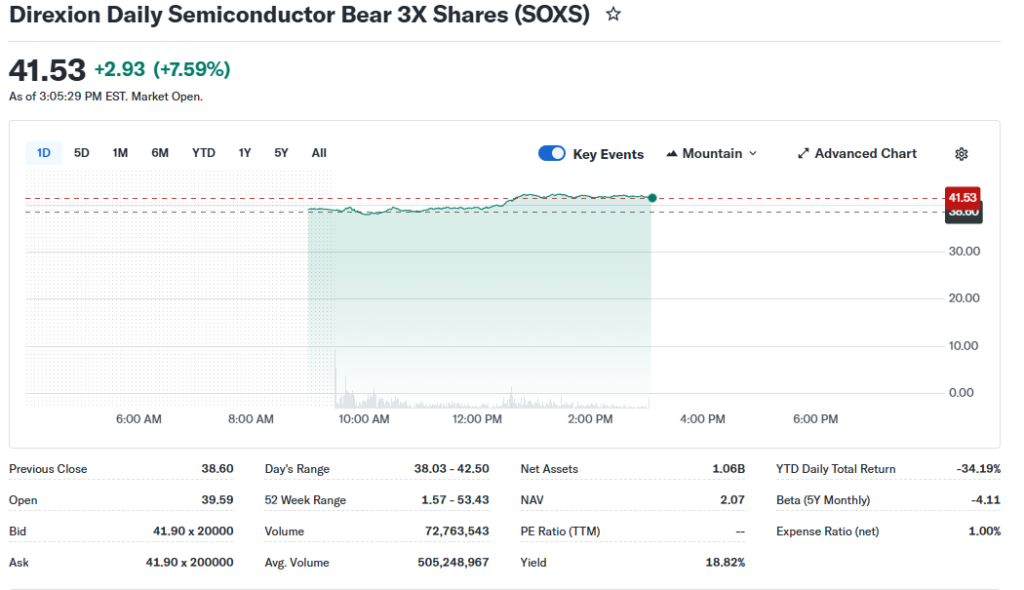
At last market close on March 4, 2026, SOXS ETF traded at $1.94, down 5.83% that day. Volume hit 848.49 million shares, showing high activity.

One-day performance fell sharply amid sector rebound. Five-day trend stayed volatile, up 12.58% through February 27 after three-day gains. One-month data shows declines from $9+ levels in early February.
Three-month trend points bearish, with prices dropping from $10-13 range. Six-month losses accelerated from split-adjusted highs. Year-to-date through early 2026, SOXS ETF shed value as the index rose.
52-week high hit around $14, low near $1.89. Overall trend stays bearish for SOXS ETF. Investors see this as a sign of semiconductor strength, making inverse plays risky.
Technical Analysis
Support levels sit near $1.89, the recent low where buyers may step in. Resistance looms at $2.03, today’s high, blocking upside moves. These levels matter as they signal potential reversal points for traders.

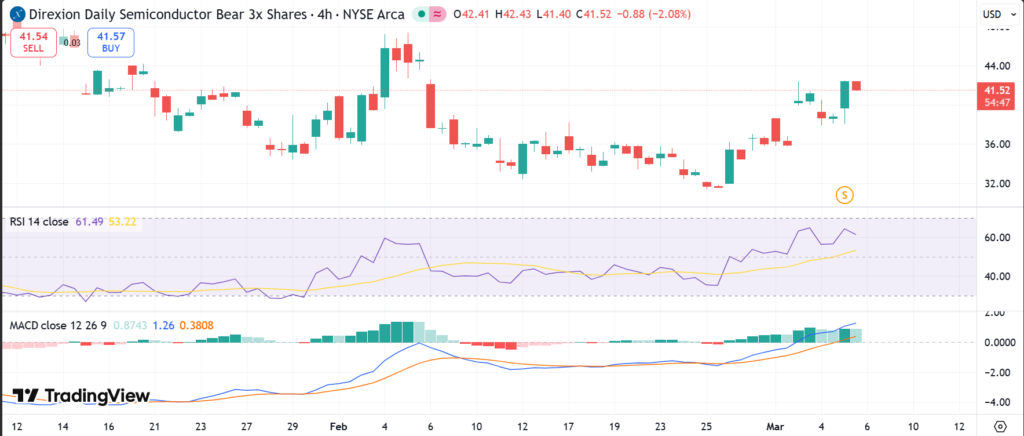
RSI reading hovered neutral around 50 recently, avoiding overbought or oversold extremes. It flags momentum without exhaustion. MACD shows mixed signals, with short-term bullish crosses but long-term bearish bias from sector trends.
50-day moving average exceeds price near $3-4 levels, while 200-day lags lower post-split. No golden cross appears; instead, death cross lingers from prior declines. These averages guide trend direction for beginners.
Trading volume surged to 848M on March 4, up from averages, hinting at conviction in downside moves. Volume trends confirm if rallies hold or fade.
Analyst Ratings & Price Targets
Few traditional Buy/Hold/Sell ratings exist for leveraged ETFs like SOXS due to daily reset risks. Tickeron patterns suggest short-term uptrend odds at 69% post three-day gains, but no firm Wall Street targets.
Recent notes from Seeking Alpha highlight tactical use, not long holds. No major upgrades noted. Analyst sentiment warns retail investors of volatility, favoring shorts in bull markets.
This means caution for everyday investors chasing SOXS ETF.
Insider Activity
Direxion ETFs like SOXS have no traditional insiders like CEOs. Management activity ties to fund flows, not share buys/sells. No large insider transactions reported, as leveraged products lack such data.
Trends show institutional caution, with 1-year returns at -92.55%. This implies low confidence in holding SOXS ETF long-term.
Valuation Analysis
Leveraged ETFs like SOXS skip standard ratios like trailing P/E or EPS growth. Management fee stands at 1.02%, with annual yield near 18.88% from dividends. Free cash flow and debt metrics do not apply directly.

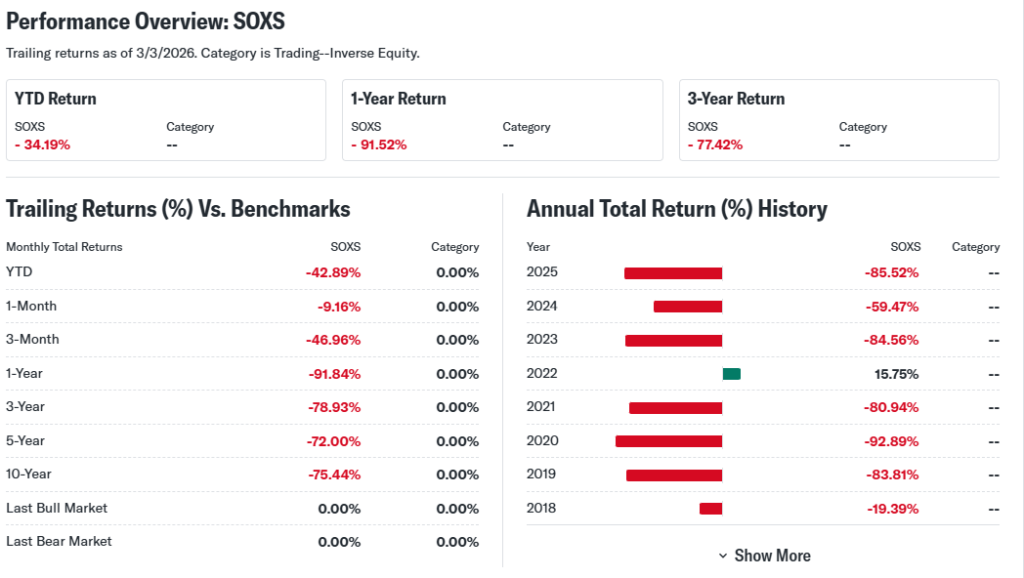
Revenue ties to AUM, down amid poor performance. Compare to bullish peers like SOXL: SOXS lost 99% over 5 years versus SOXL gains. SOXS ETF appears overvalued as a bet against strong semis, fairly valued only for day trades.
Recent Earnings & Catalysts
ETFs report no quarterly earnings; performance tracks the index inversely. Latest moves reflect semiconductor earnings beats from NVDA, AMD in Q4 2025.
No forward guidance, but AI chip demand acts as anti-catalyst for SOXS ETF. Split 1-10 on April 15, 2024, adjusted prices lower. Strong index results crushed SOXS performance.
Bullish Case
SOXS ETF rises if semis correct on overvaluation or supply glut. Tariff hikes could hit chipmakers. Recession fears might cut demand.
Operational leverage amplifies 3x downside in the index. Short-term uptrends like +12.58% show tactical wins.
Bearish Case
Semiconductor rally persists on AI, data centers. Competition from China chips adds volatility but favors bulls long-term.
Margin decay from daily resets erodes holds over weeks. 3-year return -99.13% proves risks. Economic slowdown unlikely soon under Trump policies.
Market Sentiment & Investor Psychology
Short interest data sparse for ETFs, but high volume signals tactical trading. Options activity leans puts for inverse plays, calls rare.
Institutional ownership low; retail chases momentum. Sentiment stays fearful for SOXS ETF holders, optimistic for semis. Neutral bias overall.
Short-Term Outlook
Technicals show support at $1.89 holding. Volume spikes suggest momentum tests $2 resistance.
If semis pause, SOXS ETF could rebound 5-10%. Watch index pullbacks without firm promises.
Medium to Long-Term Outlook
Business model suits day trades, not buy-and-hold. Industry growth in AI weakens inverse ETFs.
Financial health solid via Direxion, but competitive semis dominate. Long-term investors should watch or avoid; accumulate only on major downturns.
FAQ Section
Is SOXS ETF a buy right now?
No for long-term; suits shorts on semi dips. High volatility fits traders.
What is the price target for SOXS ETF?
No consensus targets; patterns eye short-term upside to $2.
What are major risks for SOXS ETF?
Daily decay, semi bull market, reset losses over time.
SOXS ETF forecast 2026?
Bearish long-term if AI boom continues; tactical shorts possible.
Suggestions
Compare with SOXL ETF for bull view
See our semiconductor sector forecast
Read Direxion leveraged ETF guide
Conclusion
Watchlist SOXS ETF for tactical shorts on semi peaks. Strong index trends favor bears staying sidelined long-term. Balanced view: High risk caps rewards.
Disclaimer: This article is for informational purposes only and not financial advice.