

Direxion Daily Semiconductor Bull 3X Shares (SOXL) Technical Analysis
The Direxion Daily Semiconductor Bull 3X Shares (SOXL) is a leveraged ETF designed to deliver three times the daily performance of the NYSE Semiconductor Index, focusing on U.S. semiconductor companies across integrated circuits, memory chips, and equipment makers. Traders watch SOXL closely amid ongoing AI-driven demand for chips, sector volatility from supply chain issues, and leveraged exposure that amplifies short-term moves in tech giants like NVIDIA and AMD. This article breaks down SOXL’s March 2026 trend, key support and resistance levels, indicators like RSI and MACD, and short-term outlook for retail traders.
In early March 2026, SOXL reflects heightened interest in semiconductors due to potential earnings from key players and macro events like Federal Reserve updates, making it a focal point for swing traders seeking leveraged plays.

Current Price Trend in March 2026
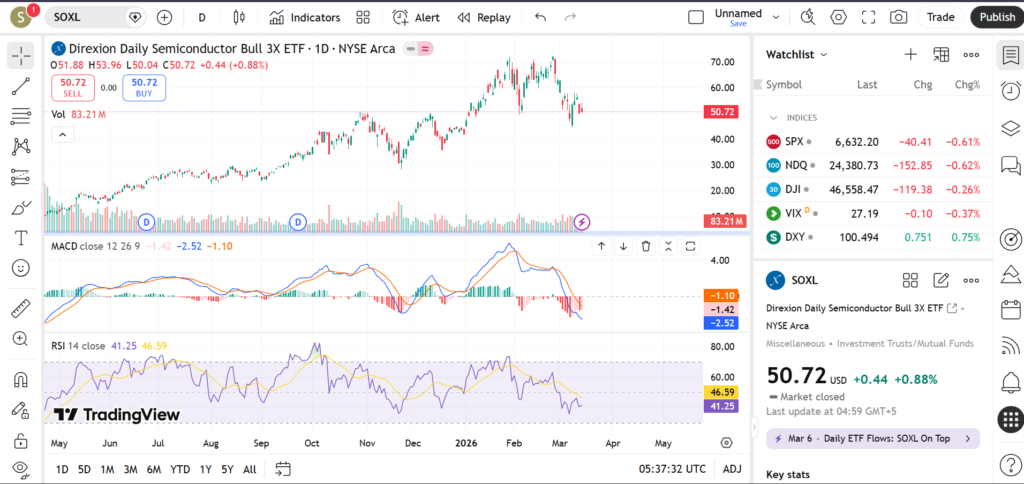
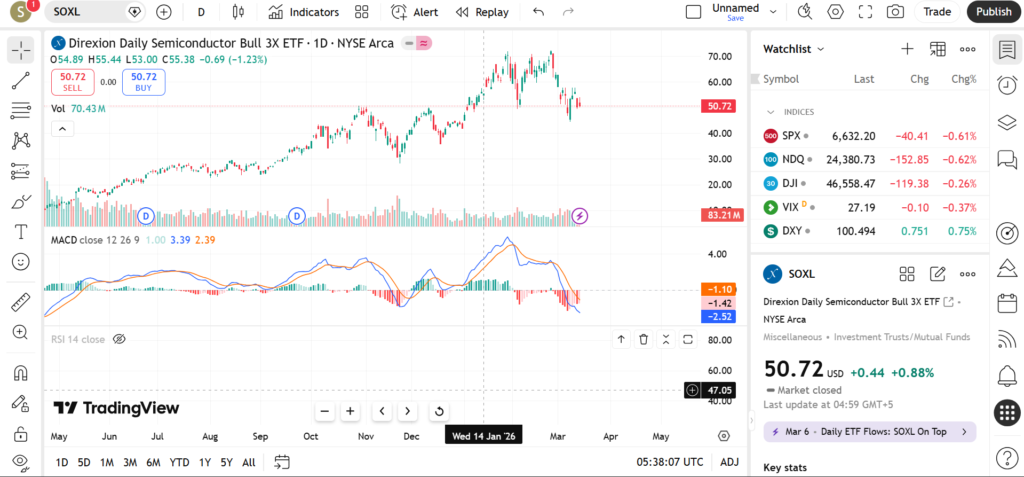
SOXL has shown choppy price action in March 2026, leaning toward a short-term range-bound trend after a late-February pullback from prior highs tied to AI hype. The ETF trades above its 20-day moving average but struggles near the 50-day MA, with recent swings reflecting broader semiconductor sector consolidation amid mixed chip demand signals; the 200-day MA provides longer-term support below current levels. This setup suggests buyers stepping in on dips near recent lows, while sellers cap upside at prior swing highs, creating a textbook range for traders to monitor for breakouts.
Educational note: Moving averages help gauge momentum—prices above the 20/50-day signal potential uptrends, while crosses below may hint at weakness without confirming trades.
Key Support and Resistance Levels
Support Levels:
- Near the 20-day MA (recent swing low from early March): This dynamic level has held on pullbacks, acting as a quick rebound zone due to buyer interest post-dip.
- Around prior February lows (near 52-week intermediate bottom): A psychological round number where volume previously spiked, potentially drawing dip-buyers if tested.
- 50-day MA cluster (key monthly support): Aligns with a gap fill from late 2025, where historical bounces occurred during sector rotations.
- 200-day MA (major long-term floor): Strong historical support from bull runs, often respected in leveraged ETFs like SOXL.
Resistance Levels:
- Recent swing high from mid-February (near 50-day MA rejection): Sellers emerged here on profit-taking, signaling overhead supply.
- Upper range of current consolidation (prior gap fill): Coincides with round numbers where rallies stalled amid profit-taking.
- 52-week high extension: Psychological barrier if momentum builds, tied to peak AI enthusiasm levels.
- Multi-month pivot (near 100-period MA on daily chart): Where extended rallies have reversed due to leverage decay.
A break above key resistance could signal bullish continuation toward higher targets, encouraging traders to watch for volume confirmation. Conversely, a drop below major support might indicate bearish momentum, prompting caution on long positions.

Indicators – RSI, MACD, Volume
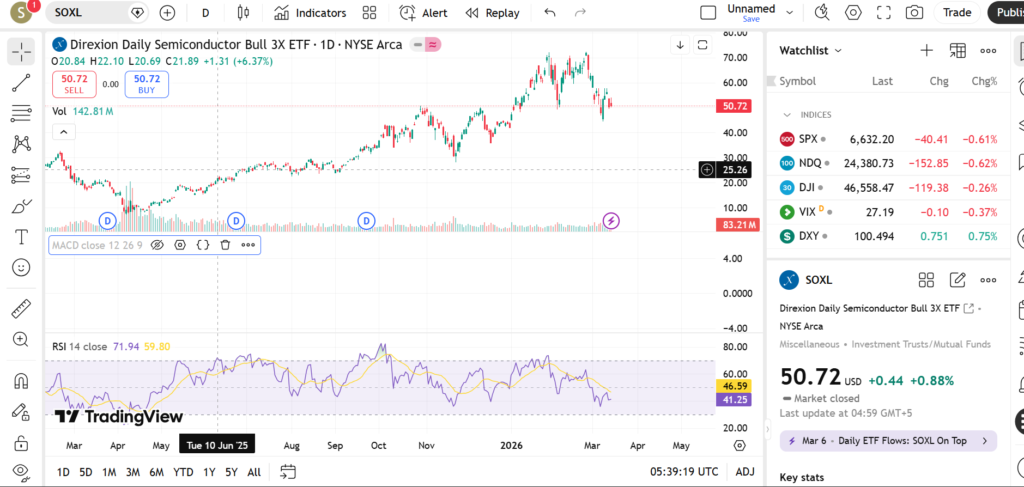
RSI (14-period) hovers in neutral territory around 50 in March 2026, neither overbought (above 70) nor oversold (below 30), suggesting room for movement without immediate exhaustion. This balanced reading aligns with the range-bound price action, where traders may eye divergences for early reversal clues.
MACD shows fading bullish momentum with the signal line flattening after a prior crossover, hinting at potential consolidation or mild bearish tilt if histogram bars shrink further. Momentum could pick up on a fresh crossover, but current setup advises patience.
Volume has been rising on pullbacks to support—indicating accumulation—while fading slightly on rallies to resistance, a healthy sign for potential upside if buyers commit. Big spikes accompanied recent swings, underscoring leveraged ETF sensitivity to sector news.

Short-Term Outlook for SOXL in March 2026
Overall, SOXL’s March 2026 technical picture points to range trading with bullish bias if supports hold, driven by semiconductor resilience amid AI tailwinds, though leverage amplifies risks in sideways markets. Traders may find opportunities fading extremes within the defined range, watching for catalysts to spark directional moves.
What traders are watching:
- Break above resistance near recent highs for confirmation of uptrend resumption, potentially fueled by NVIDIA earnings or chip demand data.
- Test of 20-day MA support; a hold could attract dip-buyers eyeing sector rotation.
- Volume surges alongside MACD crossovers as momentum signals.
- Macro events like Fed rate decisions or trade policy updates impacting semis.
- Broader Nasdaq moves, given SOXL’s 3x sensitivity to tech volatility.
Risks and Important Notes
Technical levels in leveraged ETFs like SOXL can fail unexpectedly due to sudden news, such as supply chain disruptions, geopolitical tensions, or shifts in AI investment hype. Daily compounding and volatility decay mean holding beyond short-term trades might erode returns, even in favorable trends—always use stop-losses and position sizing.
This analysis is educational and based on historical patterns; past performance doesn’t predict future results. Retail traders should conduct their own research and consider risk tolerance.
For more insights, check our technical analysis on related leveraged tech ETFs or semiconductor peers—stay informed to trade smarter.