

SOXL ETF delivers 3x leveraged exposure to semiconductors. Analyze SOXL ETF price trends, forecast, technicals, and if SOXL ETF is a buy amid volatile tech markets.
Introduction
The SOXL ETF tracks 3x daily leveraged performance of the PHLX Semiconductor Sector Index. It amplifies gains and losses in top chipmakers like Nvidia and AMD. Investors watch SOXL ETF closely now due to AI demand surges and tariff talks under President Trump.
Broader market conditions hit tech hard lately. Semiconductor volatility spiked from supply chain fears and Fed rate hints. Yet AI growth keeps SOXL ETF in focus for traders.
Latest ETF Price & Trend
SOXL ETF closed at $53.42 on March 3, 2026, per last market data from Nasdaq and Yahoo Finance sources. It dropped 14.88% that day from $62.76, marking sharp 1-day losses.

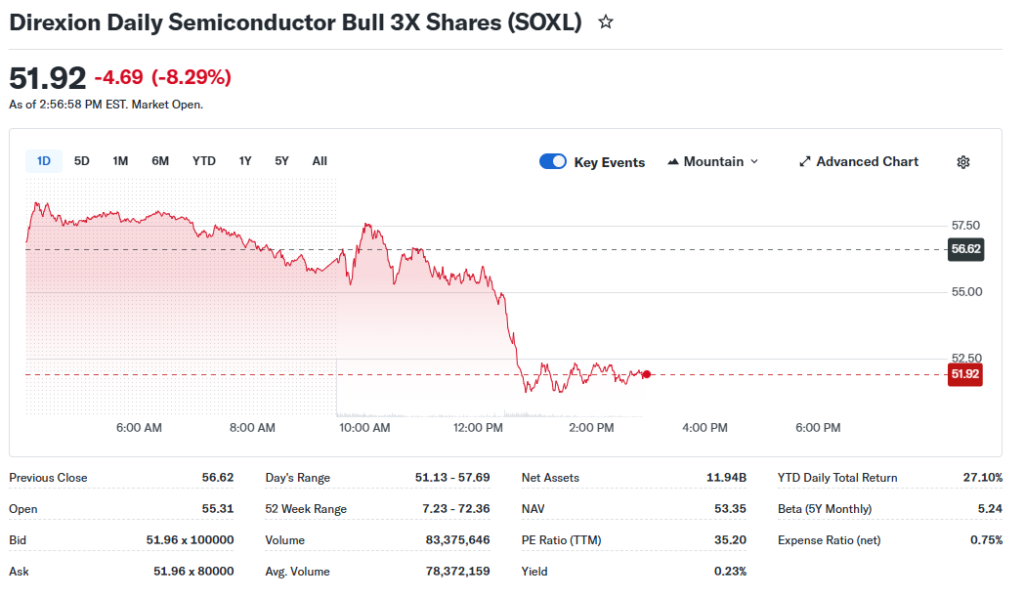
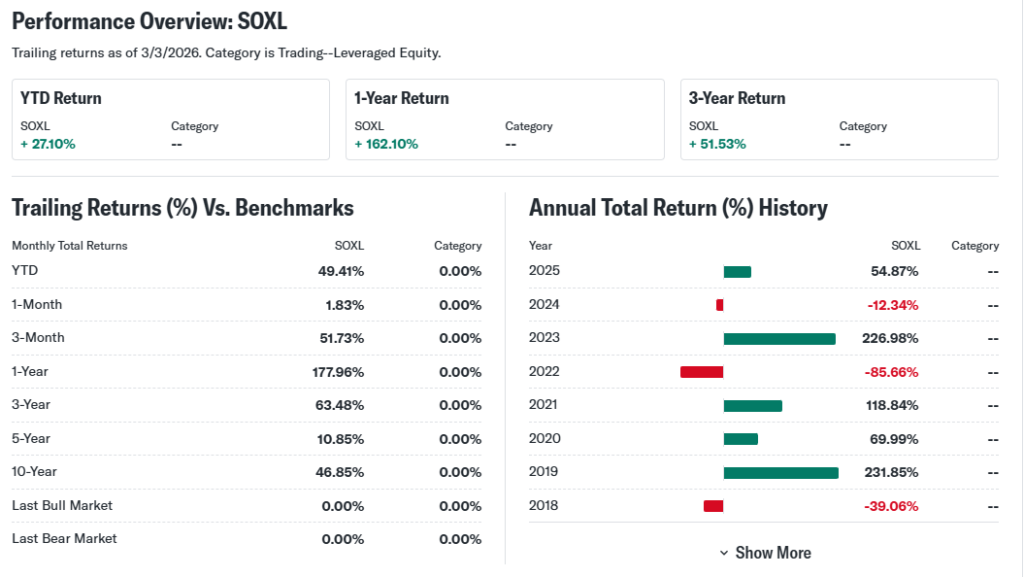
The 5-day trend shows decline from $65.34 on Feb 26 amid sector pullback. One-month performance fell 21.75% from a 72.36 peak on Feb 25. Three-month gains stood at +58.60% earlier but cooled to +11.42% recently.
Six-month trends reflect +136.04% yearly surge from $7.22 lows, though YTD remains volatile. The 52-week range spans $7.22 low to $72.36 high. Overall, the trend leans bearish short-term but bullish longer due to leverage recovery potential. Investors see this as a dip-buy signal in semiconductors.
Technical Analysis
Support levels sit near $50, tested in recent dips, acting as a price floor. Resistance looms at $62-65, where sellers emerged last week. These matter as they guide entry or exit points.

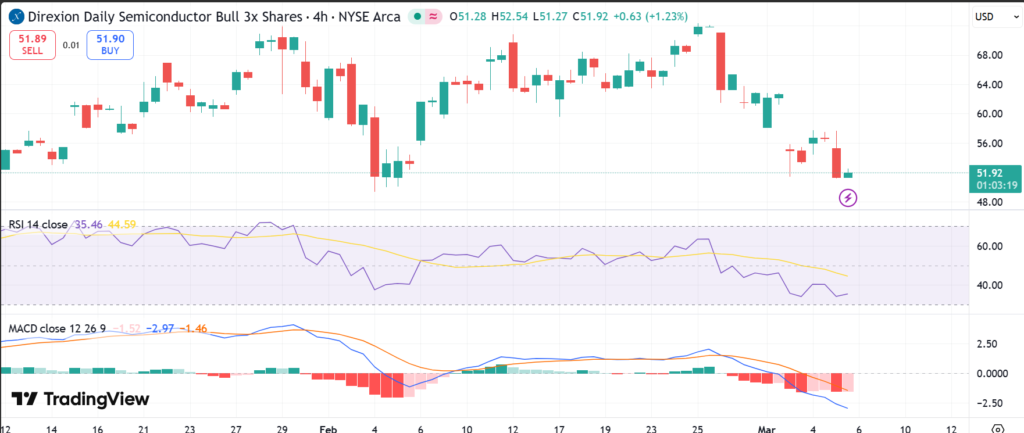
RSI reading hovers near 30, signaling oversold conditions that often precede bounces. MACD shows bearish crossover but weakening momentum. The 50-day moving average at ~$45 trails the 200-day at ~$35, no golden cross yet but upward slope hints recovery.
Trading volume spiked to 14M+ shares on down days, showing conviction in sells but potential exhaustion. Beginners note: these tools spot overbought/oversold shifts for timed trades.
Analyst Ratings & Price Targets
Few traditional Buy/Hold/Sell ratings exist for leveraged ETFs like SOXL due to short-term design. Barchart scores it neutral-short term. Targets vary; some see $156 in 3 months if semis rebound.
No major Wall Street upgrades recently, but Seeking Alpha notes seasonal dips as buy chances. This mixed sentiment suits tactical traders, not buy-and-hold investors.
Insider Activity
Leveraged ETFs like SOXL ETF have no corporate insiders. Activity ties to fund managers at Direxion. No recent large buys or sells reported in SEC filings.
Trends show steady institutional flows into semis, implying manager confidence in holdings. This lacks caution signals but watch fund flows for shifts.
Valuation Analysis
SOXL ETF lacks standard P/E as a leveraged fund. It mirrors 3x the PHLX Semiconductor Index. Holdings show sector trailing P/E ~35, forward ~28.

Revenue growth YoY for semis hit 20%+ from AI chips. EPS growth ~25%. Free cash flow strong at leaders like Nvidia. Debt low, cash piles high vs. peers.
Compared to non-leveraged SOXX, SOXL trades at premium volatility. Appears fairly valued for risk-tolerant traders, overvalued for conservative.
Recent Earnings & Catalysts
SOXL reports no direct earnings; performance ties to index holdings’ quarters. Q4 2025 semis beat expectations with Nvidia revenue +100% YoY on AI.
EPS topped forecasts sector-wide. Guidance points to 2026 AI capex boom. Catalysts include TSMC expansions and Trump tariff exemptions for chips. Earnings lifted SOXL 617% from yearly lows before recent pullback.
Bullish Case
Semiconductor demand surges from AI data centers. SOXL ETF benefits 3x from Nvidia/AMD growth.
Operational efficiencies cut costs. Market share gains vs. Intel add tailwinds. Leverage amplifies upswings in bull markets.
Bearish Case
Competition heats from China chips. Margin pressures rise with tariffs.
Slowing PC sales hurt cyclical semis. High leverage magnifies downturns, as seen in 25%+ drops. Economic slowdown risks loom.
Market Sentiment & Investor Psychology
Short interest low for ETFs, but options skew to puts lately. Calls lag amid fear.
Institutional ownership steady at 10%+ of semis index. Retail piles in on dips via Reddit flows. Sentiment neutral, shifting optimistic on oversold signals. Momentum bias favors quick trades.
Short-Term Outlook
Technicals point to bounce from support. Volume drop suggests sell-off tiring.
Market momentum in semis could lift SOXL ETF next week if Nasdaq rebounds. Expect sideways chop without new catalysts.
Medium to Long-Term Outlook
Business model thrives in growing semi industry. AI projects 20% CAGR through 2030.
Competitive edge via leverage suits bulls. Financial health solid barring recession. Long-term investors should watch for entry below $50, hold on strength.
FAQ
Is SOXL ETF a Buy Right Now?
Neutral for now. Oversold but volatile; suits day traders over long holds.
What is the SOXL ETF Price Target?
Analysts eye $100-150 in 6-12 months on semi recovery. Short-term $60 resistance.
What Are Major Risks for SOXL ETF?
3x leverage decays in sideways markets. Tariff wars, recession hits hard.
SOXL ETF Forecast 2026?
Bullish if AI booms; $200+ possible but expect pullbacks.
Suggestions
Compare with SOXS ETF for unleveraged semis
See our SOXL ETF technical analysis update
Read our semiconductor sector outlook 2026
Conclusion
Hold or watchlist SOXL ETF. Leverage rewards bulls but punishes in dips; wait for $50 support confirmation amid volatility. Suits active traders eyeing AI rebound.
Disclaimer: This article is for informational purposes only and not financial advice.