

Explore SOXL ETF price, technical analysis, forecast, and ratings. Get insights on Direxion Daily Semiconductor Bull 3X ETF for smart investing decisions today.
Data as of April 20, 2026 — last market close data.
Introduction
The SOXL ETF tracks three times the daily performance of the semiconductor index. It gives leveraged exposure to chipmakers like Nvidia and AMD. Investors watch SOXL ETF closely now due to AI demand and trade tensions. Broader tech rallies lift it, but volatility from rates hurts leveraged funds.
Semiconductors power phones, cars, and data centers. SOXL ETF appeals to traders seeking big moves. Recent chip shortages eased, yet supply chains stay key. Everyday investors use it for short-term bets, not long holds.
Price & Trend
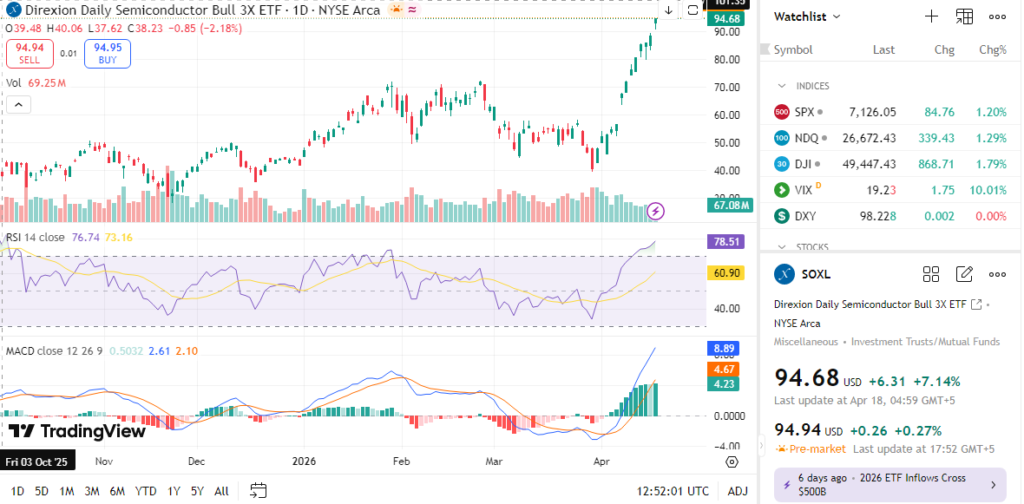
SOXL ETF closed at $93.95 on April 20, 2026. It saw a daily high of $95.75 and low of $89.67, ending 4.8% above the low. The 52-week range spans wide due to leverage, with highs near $95 and lows much lower earlier.
One-day performance showed gains amid sector rotation. Five-day trend stayed firm as semis outperformed. One-month returns hit 37.69%, fueled by AI hype. Three-month gains reached 83.20%, while year-to-date trends point up 33.89% or more.
Six-month trends reflect volatility decay in leveraged ETFs. Overall direction looks bullish short-term, but long holds risk erosion. Investors see momentum, yet caution on pullbacks. Trends signal opportunity for traders, not buy-and-hold.


Technical Analysis
Support levels sit near $89.67 from recent lows. Resistance looms at $95.75 daily high. These levels matter as prices bounce or break them to signal direction.
RSI at 65.67 reads neutral, not overbought yet. Values over 70 flag sell risks; under 30 means oversold buys. It gauges momentum speed.
MACD shows bullish cross in recent data. This histogram confirms uptrends when lines align. It spots shifts early.
50-day moving average trends above price action. 200-day lags further, no golden cross yet. Moving averages smooth noise and show trend strength.
Volume spiked on up days, supporting rallies. High volume confirms real moves, not fakes. SOXL technical analysis points to buy signals today.

Analyst Ratings & Price Targets
Few traditional ratings cover leveraged ETFs like SOXL. TradingView summary rates it strong buy short-term. No standard Buy/Hold/Sell counts from Wall Street firms.
Price targets vary wildly due to 3x leverage. Average sits optimistic near recent highs. Highest targets eye $100+ on bull runs; lows warn of $80 drops.
No recent upgrades noted for ETFs. Sentiment leans positive from tech momentum. Analysts view it as a tactical tool, not core holding. Ratings help gauge pro views.
Insider Activity
Leveraged ETFs like SOXL ETF have no insiders. No buying or selling applies here. Management activity stays irrelevant. Focus shifts to underlying holdings’ insiders.
Valuation Analysis
ETFs lack P/E ratios directly. SOXL mirrors semis at high multiples, around 30-40 trailing. Forward P/E eyes lower on growth bets. No direct price-to-sales, but sector averages 10x.
Revenue growth ties to index, up double-digits YoY. EPS growth mirrors chip demand. Free cash flow strong in holdings like NVDA. Debt low overall.
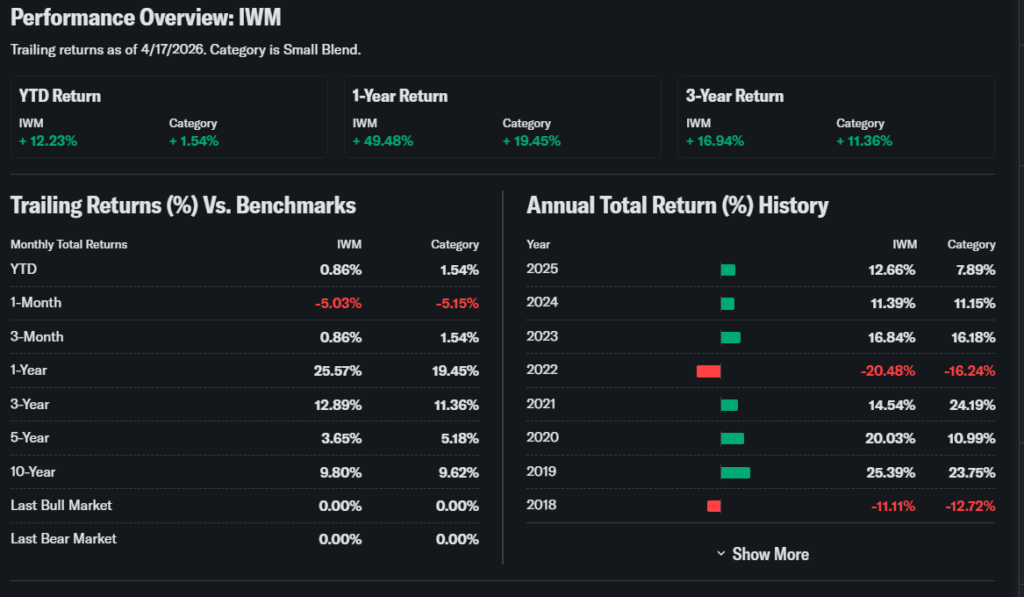
Compare to SOXX unleveraged ETF—SOXL trades at premium 0.07%. Appears fairly valued for traders, overvalued for long-term due to decay.
Recent Earnings & Catalysts
SOXL reports no earnings. Performance tracks index daily. Latest moves stem from NVDA and TSM results beating views.
Catalysts include AI chip launches and US fabs. Trade deals boost supply. Earnings from holdings drove recent 37% monthly surge.
Bullish Case
AI demand fuels semis long-term. Data centers need more chips yearly. SOXL ETF amplifies index gains 3x daily.
Supply ramps from Intel, TSMC help. Tech edges in nodes keep leaders ahead. Operational efficiencies cut costs.
Bearish Case
Leverage causes decay over time. Volatility eats returns in sideways markets. Competition heats from China fabs.
Margin squeezes if demand slows. Recession hits chips first. Regulatory curbs on exports loom.
Market Sentiment & Investor Psychology
Short interest low for ETFs. Options show call buying over puts lately. Institutional ownership high in semis.
Retail chases momentum trades. Sentiment skews optimistic on AI narrative. Overall, neutral to bullish bias.
Short-Term Outlook
Technicals favor upside with buy signals. Volume backs momentum. Expect swings near $90-96. Watch resistance break.
Medium to Long-Term Outlook
Model suits day trades, not years. Industry grows, but 3x erodes holds. Strong semis position helps briefly. Watch, don’t accumulate long.
FAQ Section
Is SOXL ETF a buy right now?
Strong buy signals short-term, but high risk for novices.
What is the SOXL ETF price target?
Varies; bulls eye $100+, bears $80 range.
SOXL forecast next month?
Bullish if semis rally, per 37% recent gains.
Major risks for SOXL ETF?
Leverage decay, volatility, sector downturns.
SOXL ETF technical analysis summary?
Buy on averages, neutral RSI.
Suggestions
- Compare with SOXX ETF analysis
- See NVDA semiconductor forecast
- Read tech sector outlook 2026
Conclusion
Hold for traders; watch for others. Leverage boosts wins but magnifies losses in volatile semis. Use sparingly.
Buy / Hold / Watchlist: Watchlist
Disclaimer: This article is for informational purposes only and not financial advice.