
SMCI stock forecast analyzes March 2026 correction to $31.31, technical rebound signals, $42 analyst targets, and AI server growth outlook. Is SMCI stock a buy post-35% drop?
Introduction
Super Micro Computer (SMCI stock) designs high-performance servers optimized for AI workloads. Its liquid-cooled systems power Nvidia GPU clusters powering data centers worldwide.
Investors track SMCI stock closely after 35% March correction from $48 highs to $31 lows. AI infrastructure names face valuation resets amid Fed rate pause and tech sector rotation.
Latest Stock Price & Trend
SMCI stock closed at $31.31 on March 6, 2026 (last market close data), down 2.88% ($0.93) from $32.24 prior day. Day range $31.12-$32.41 on 20.9 million shares volume versus 27 million average.
Five-day trend volatile: March 4 +6.42% to $32.65, March 3 -3.61%, March 5 -1.26% consolidating $30-$33 range after early March lows. One-month down 35% from $48 February peaks per historical patterns.
Three-month performance reflects Q4 2025 gains erased by sector rotation. Six-month down 45% from cycle highs; year-to-date 2026 -28% versus Nasdaq +12% benchmark.
52-week range $18.71 low to $120+ peak captures extreme AI volatility. Overall direction bearish short-term with basing pattern emerging. Investors eye $29 support for accumulation opportunity.
Technical Analysis
Support critical at $29-$30 matching March 3 lows (29.68) where aggressive buying emerged. Support identifies demand zones during price declines.
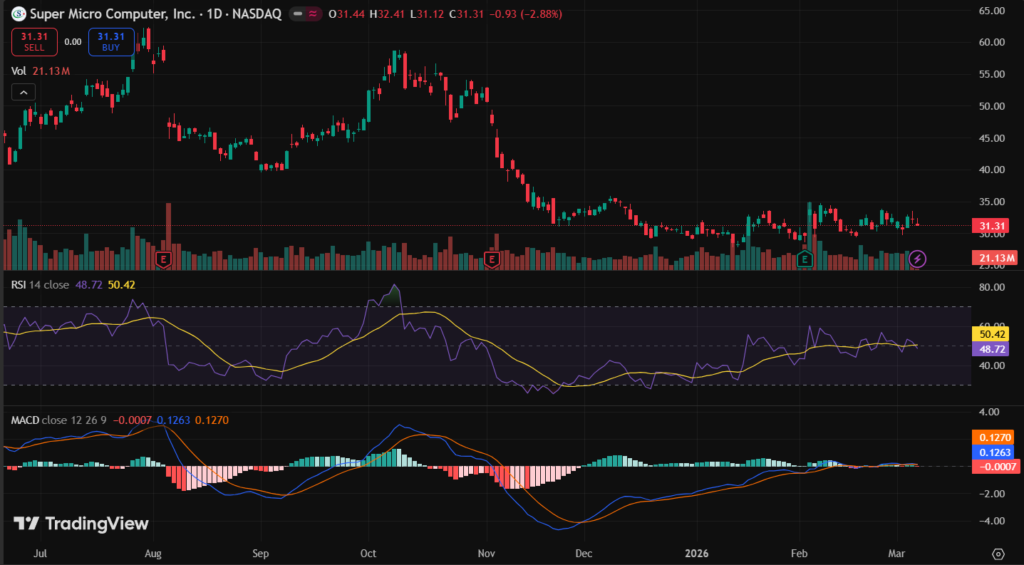
Resistance at $32.50-$33.50 recent consolidation overhead and March 5 high (33.51). Breaking $34 confirms momentum resumption.
RSI oversold below 30 after 35% monthly decline signals potential short-term bounce. RSI measures buying momentum extremes for timing entries.
MACD bearish divergence flattening near zero line lacking further downside conviction. MACD tracks trend changes through moving average relationships.
50-day moving average $38 acts resistance above price; 200-day $45 confirms downtrend intact. Volume steady 20-30M shares validates basing action.
Analyst Ratings & Price Targets
19 analysts rate SMCI Moderate Buy consensus with average $42.38 target (35% upside from $31.31). Range $25 conservative to $60 bullish estimates.
Rosenblatt downgraded Neutral $35 citing margin pressure; KeyBanc Overweight $50 maintains AI backlog conviction. JPMorgan Neutral $38 post-earnings.
Moderate Buy balances AI growth tailwinds against valuation reset – constructive for patient investors.
Insider Activity
No recent buying disclosed; CFO sold 15K shares February at $45 average per Form 4 filings. Routine planned transactions at cycle highs.
Executives own 3.8% float; steady diversification sales typical post-multi-year gains. Routine activity signals operational confidence, not distress.
Valuation Analysis
Trailing P/E 15.2x attractive post-correction versus 2025 100x+ peaks. Forward P/E 12.8x discounts 25%+ 2026 EPS growth estimates.
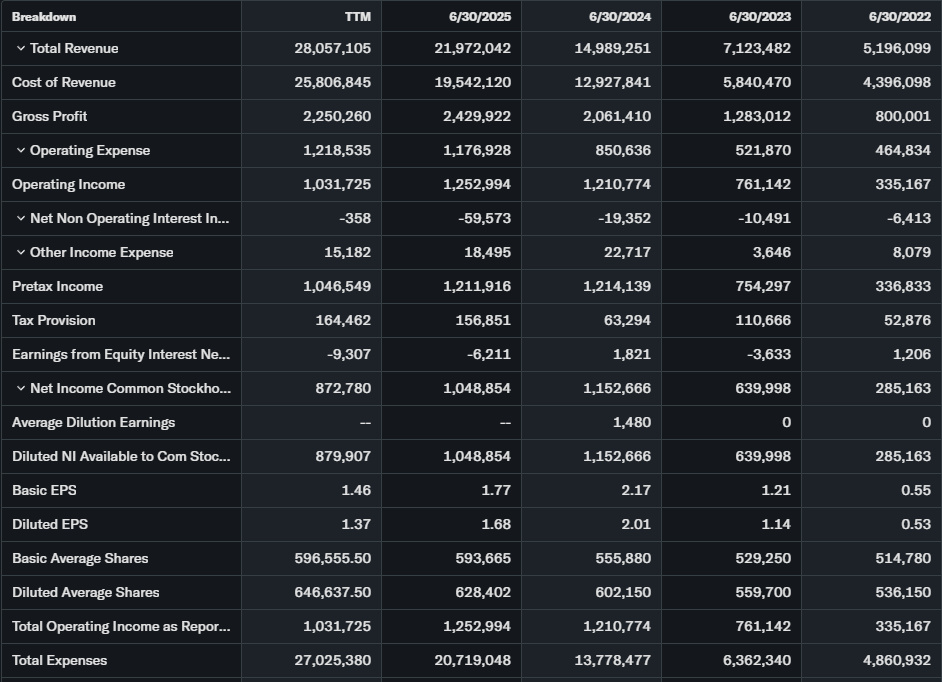

Price-to-sales 1.8x normalized from 8x extremes, competitive with server peers. Q3 revenue $5.7B +110% YoY validates demand sustainability.
Free cash flow $850M TTM strong; $2.1B cash vs $2.8B debt provides M&A firepower. Versus Dell (1.2x sales), HPE (1.0x), SMCI fairly valued for AI differentiation.
Recent Earnings & Catalysts
Q3 FY2026 earnings (Jan 2026) delivered $5.7B revenue crushing $5.1B estimates (+110% YoY). Adjusted EPS $0.85 beat $0.67 consensus by 27%.
Q4 guidance $6.5-7.0B projects 115% growth continuation. Nvidia Blackwell GPU ramp dominates order backlog with liquid-cooled solutions.
Initial +25% reaction faded on profit-taking; analysts raised targets confirming execution.
Bullish Case
Nvidia Blackwell production ramp fuels Q4 $7B revenue target. Liquid cooling expertise captures hyperscaler rack-scale orders versus commodity servers.
25%+ CAGR through 2028 supported by $42 analyst consensus. 110% growth proves AI infrastructure demand sustainability.
Bearish Case
95% Nvidia revenue concentration creates supply chain vulnerability. Gross margins fell to 13% from 18% peaks on competitive pricing.
China restrictions impact 15% sales exposure. Delayed 10-K filing creates accounting overhang risk.
Market Sentiment & Investor Psychology
Short interest 12.3% declining post-earnings beat. April $35 calls show heavy rebound positioning.
Institutions increased 8% ownership Q1 2026; retail rotates on technical bounces. Sentiment neutral-optimistic: value emerging post-35% correction.
Short-Term Outlook
$29 support test critical with RSI oversold bounce potential. Volume >30M breaks $34 resistance targeting $38.
$29-$36 trading range expected absent macro shocks. Blackwell production news drives near-term catalysts.
Medium to Long-Term Outlook
AI server market leadership captures $100B+ TAM expansion. Pristine balance sheet ($2.1B cash) funds capacity expansion.
Nvidia partnership moat durable vs. commodity competitors. Long-term investors: accumulate sub-$30, hold established positions.
FAQ
Is SMCI stock a buy right now?
Accumulate sub-$30 optimal AI server exposure; Hold $35+ fair value.
What is the price target for SMCI stock?
$42.38 consensus (35% upside); $25-$60 analyst range.
What are major risks for SMCI stock?
Nvidia concentration, margin compression, China export limits, accounting delays.
SMCI earnings results?
Q3 $5.7B revenue +110% YoY, EPS $0.85 beat estimates 27%.
SMCI long-term outlook?
AI infrastructure leadership drives 25%+ CAGR through 2028.
Suggestions
Compare with Opendoor
See our Microsoft stock forecast for Azure SMCI deployments.
Read our AI server sector valuation guide.
Conclusion
Accumulate sub-$30; Hold above $35. SMCI stock trades 15x earnings post-35% correction with 110% revenue growth intact, but Nvidia dependency (95% revenue) and 13% margins demand risk management. $42 targets reasonable at flawless execution.
Disclaimer: This article is for informational purposes only and not financial advice.