

QQQ Technical Analysis: Trend, Levels & Outlook March 2026
The Invesco QQQ Trust (QQQ) is one of the most widely traded exchange-traded funds, tracking the performance of the Nasdaq-100 Index. This index is heavily weighted toward technology and growth companies, making QQQ a key benchmark for innovation-driven sectors such as software, semiconductors, and artificial intelligence. Due to its composition, QQQ is highly sensitive to interest rates, earnings growth, and investor sentiment toward high-growth stocks.
In March 2026, QQQ is at a critical point as markets react to macroeconomic data, central bank policies, and corporate earnings. The ETF has experienced periods of volatility as traders assess whether the growth sector can sustain its momentum in a potentially shifting economic environment. This article provides a comprehensive analysis of QQQ’s current trend, key support and resistance levels, and major technical indicators.

Current Price Trend in March 2026
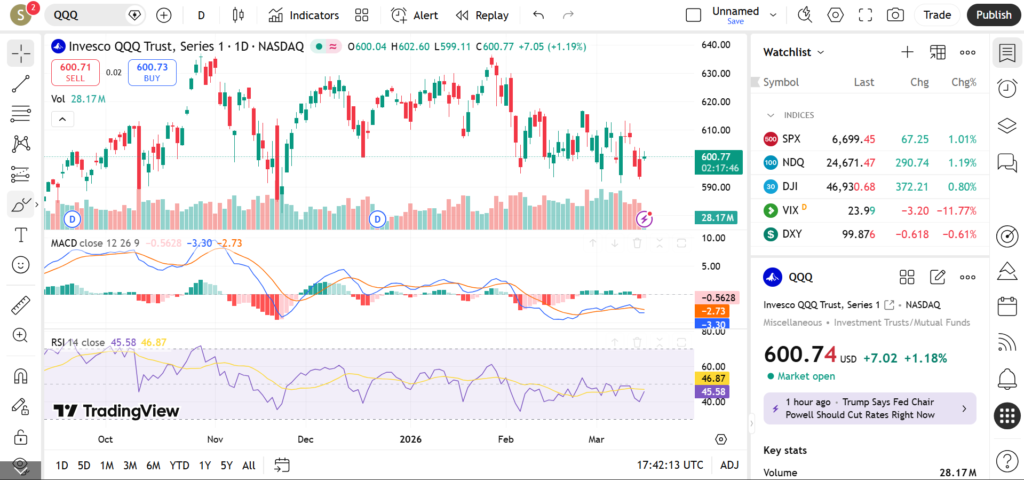
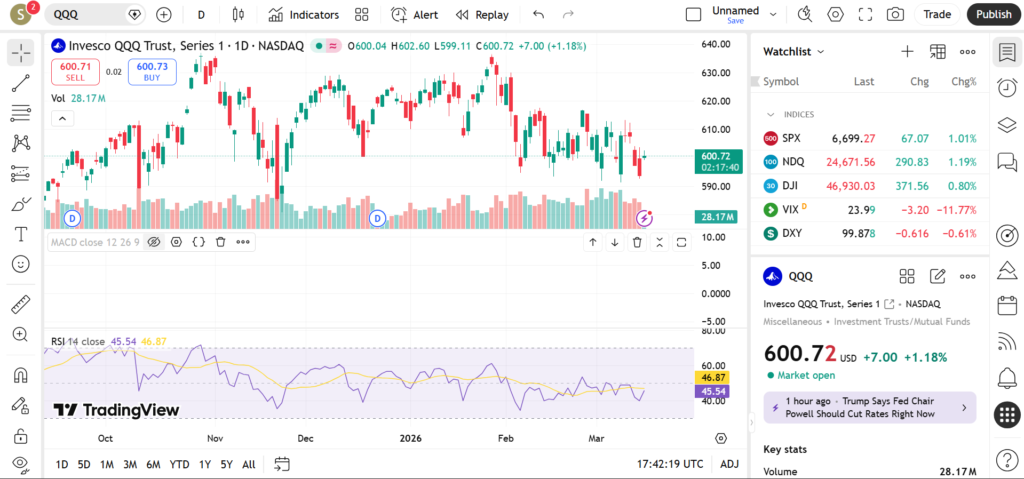
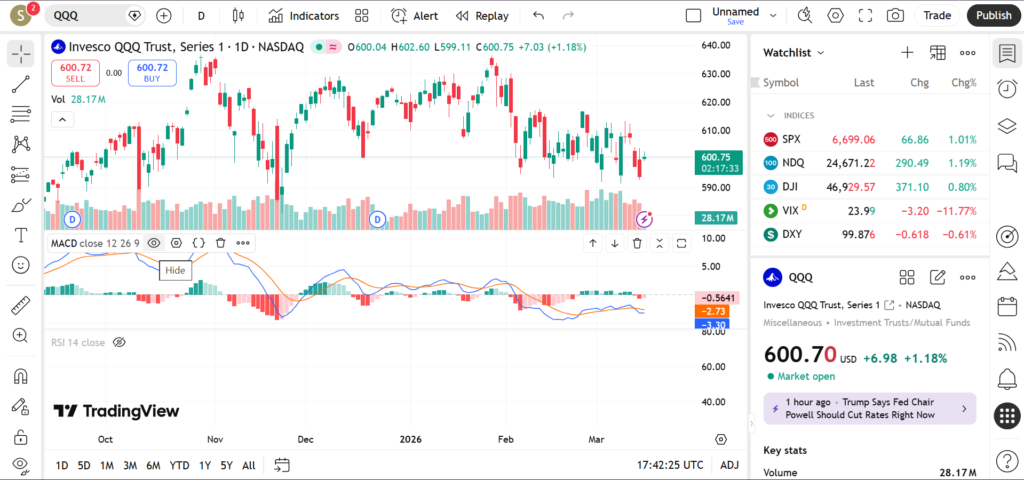
QQQ has shown a mixed but structurally bullish trend during March 2026. The ETF has experienced upward movements followed by consolidation phases, suggesting that while buyers are still active, there is hesitation at higher levels.
The 20-day moving average has been acting as a short-term trend guide. Price holding above this level indicates ongoing bullish momentum, while dips below it often lead to short-term corrections. In recent sessions, QQQ has shown sensitivity around this level, reflecting uncertainty in the near term.
The 50-day moving average serves as a key medium-term support level. During pullbacks, QQQ has attempted to stabilize near this area, indicating that institutional investors are likely accumulating at these levels. This makes the 50-day moving average a critical level for maintaining bullish structure.
The 200-day moving average remains the most important long-term trend indicator. QQQ trading above this level suggests that the broader uptrend is still intact. A breakdown below it would signal a potential shift in market sentiment.
Key Support and Resistance Levels
Support levels for QQQ are well-defined due to its structured price movement. The first major support lies near recent swing lows, where the ETF previously found buying interest during pullbacks. These levels often act as initial stabilization zones.
Another significant support level exists near the 50-day moving average. This dynamic level often serves as a foundation for upward trends and is closely monitored by traders.
A deeper support region can be found near the 200-day moving average. If QQQ approaches this level, it may indicate broader market weakness or a shift in sentiment toward growth stocks.

On the resistance side, the first key level lies near recent swing highs where price struggled to break higher. This area represents strong selling pressure.
The next resistance zone lies near previous breakout attempts that failed to sustain momentum. A successful breakout above this level could signal renewed bullish strength.
A higher resistance level exists near multi-month highs. Breaking above this level could lead to accelerated upside momentum, driven by strong earnings or favorable macroeconomic conditions.
Indicators – RSI, MACD, Volume
The Relative Strength Index (RSI) for QQQ currently sits in the neutral to slightly bullish range. This indicates that there is room for further upside before the ETF reaches overbought conditions.
MACD signals have shown periods of bullish crossovers, indicating upward momentum. However, recent flattening suggests that momentum may be slowing, potentially leading to consolidation.
Volume patterns provide additional insights into market participation. Increased volume during upward moves suggests strong buying interest, while lower volume during pullbacks indicates limited selling pressure. This combination often supports a gradual uptrend.
Short-Term Outlook for QQQ in March 2026
The short-term outlook for QQQ remains cautiously bullish but dependent on macroeconomic factors and market sentiment. If interest rates stabilize and earnings remain strong, QQQ could continue its upward trajectory.
However, concerns about inflation or economic slowdown could limit gains and lead to range-bound movement.
What traders are watching
• Federal Reserve policy decisions
• Earnings from major tech companies
• Breakouts above resistance levels
• Reactions near the 50-day moving average
• Overall market risk sentiment
Risks and Important Notes
QQQ is heavily concentrated in technology stocks, making it sensitive to sector-specific risks.
Macroeconomic factors such as interest rates and inflation can significantly impact performance.
This analysis is for educational purposes only and not financial advice.
For further insights, traders may explore other tech-focused ETFs or individual stocks within the Nasdaq-100.