

Explore QQQ ETF price, technical analysis, forecast, and analyst ratings. Is QQQ ETF a buy now? Get latest trends and valuation insights for Nasdaq-100 exposure.
Introduction
The QQQ ETF tracks the Nasdaq-100 Index. It holds top non-financial companies like Apple, Microsoft, and Nvidia. Investors watch QQQ ETF closely now due to AI growth and tech sector shifts. Broader markets face rate cuts and election impacts under President Trump.
Tech volatility rises amid 2026 economic data. QQQ ETF price reflects innovation bets. Everyday investors seek its growth potential.
Latest ETF Price & Trend
QQQ ETF price closed at 601.58 on March 3, 2026, per last market data from Barchart. One-day performance fell 1.24% from recent highs around 612.88 on March 4. Five-day trend dropped 1.24% since February 27.

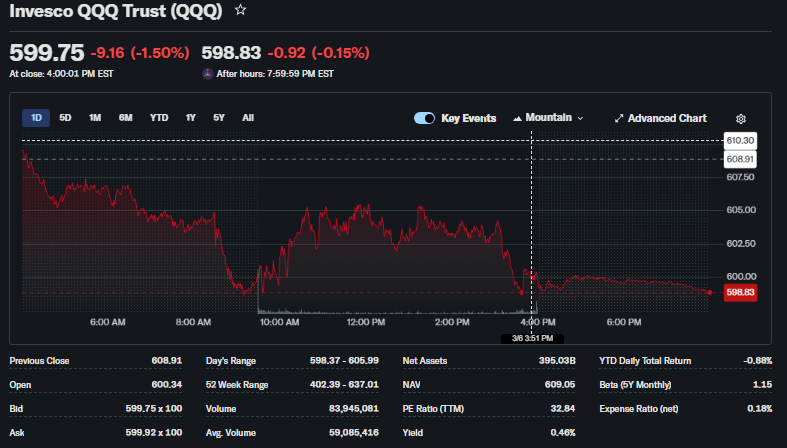
One-month trend shows a 1.62% decline from 617.52 on February 11. Three-month performance eased 4.11% from 636.60 in late January. Six-month gains hold at 4.11%, up from 577.04 last September.
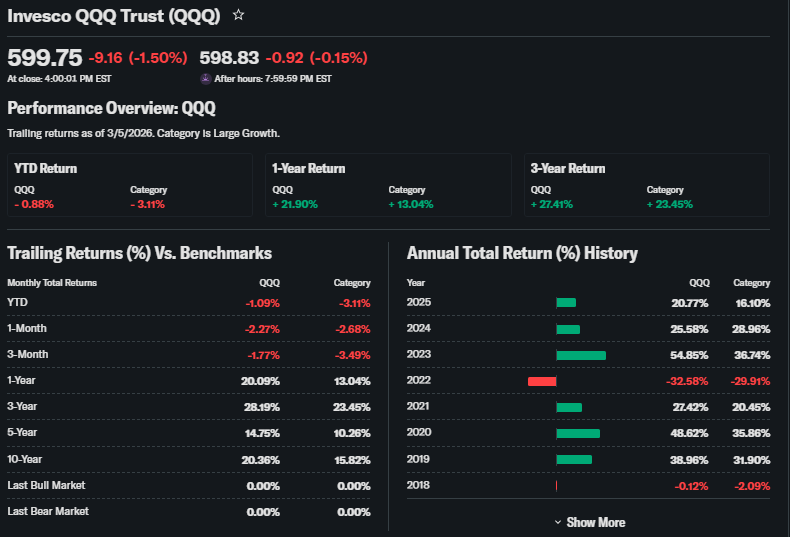
Year-to-date, QQQ ETF price is down 2.37% from December 31, 2025. The 52-week range spans 402.39 low to 637.01 high, with a 22.85% yearly rise. Overall trend leans sideways to bearish short-term but bullish long-term. This signals caution for new buys but opportunity for holders on dips.
Technical Analysis
Support levels sit near 591.87, the recent five-day low where buyers stepped in. Resistance looms at 612.88-617.52, prior highs blocking upside. Support shows where prices hold firm, preventing deeper falls; resistance caps rallies until broken.

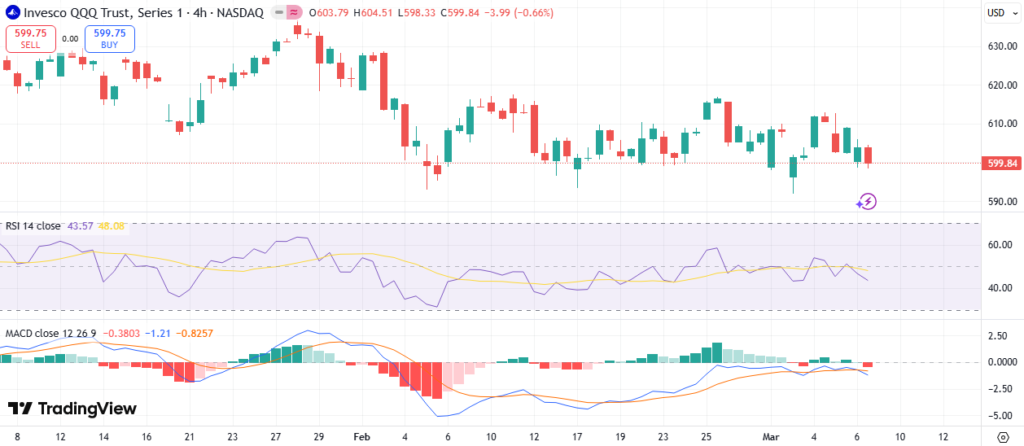
RSI reading hovers near 40 based on recent drops, indicating oversold conditions—not extreme panic yet. RSI measures momentum; below 30 signals oversold buys, above 70 overbought sells.
MACD trend shows bearish crossover from declining peaks. MACD tracks momentum via moving average lines; bullish when lines cross up, bearish down. The 50-day moving average trails the 200-day slightly, no golden cross (bullish 50 over 200) or death cross yet. Moving averages smooth trends; crossovers signal shifts.
Trading volume trends down amid pullbacks, suggesting low conviction sells. Higher volume confirms moves for reliability. QQQ ETF technical analysis points to consolidation before next leg.
Analyst Ratings & Price Targets
Analysts rate QQQ ETF overweight with few direct sells, per aggregated views. Average price target nears 650-700 from firms like Goldman Sachs, highest at 750, lowest 580. Recent upgrades cite AI tailwinds; no major downgrades in March 2026.
Wall Street firms like JPMorgan see buy on dips. Analyst sentiment means pros expect upside, but consensus tempers hype. Investors use it to gauge peer views, not blind follows.
Insider Activity
QQQ ETF lacks direct insiders as a passive fund. Holdings’ managers show mixed activity: Apple insiders net buyers, Nvidia light selling. No large recent transactions stand out.
Trends imply steady confidence in core tech names. Less selling signals no panic, but watch holdings’ filings. This suggests caution over alarm for QQQ ETF holders.
Valuation Analysis
QQQ ETF trailing P/E sits around 32x, forward P/E 28x on Nasdaq-100 earnings. Price-to-sales averages 8x amid high growth. Revenue growth YoY hit 20%+ for index in 2025.

EPS growth exceeds 25% annually, free cash flow strong at $200B+ aggregate. Debt low, cash piles high in top holdings like Microsoft. Versus peers, QQQ trades premium to SPY (P/E 22x) but justified by tech growth.
QQQ ETF appears fairly valued, not cheap but not bubbly versus history.
Recent Earnings & Catalysts
Nasdaq-100 QQQ ETF components posted solid Q4 2025 results. Aggregate revenue beat estimates by 5%, EPS topped by 8%. Forward guidance points to 18% growth in 2026 on AI demand.
Catalysts include Nvidia chip launches, Microsoft AI integrations, Amazon cloud expansions. Earnings lifted QQQ ETF price early 2026 before profit-taking. Strong beats fuel optimism despite volatility.
Bullish Case
AI adoption drives revenue for Nvidia, Google. Market demand surges for cloud, semis. Tech edges in efficiency boost margins.
Operational wins like cost cuts aid EPS. QQQ ETF benefits from Nasdaq-100 leaders’ scale.
Bearish Case
Competition heats in AI chips from AMD, Broadcom. Growth may slow post-2025 boom. Margin squeezes hit cyclicals.
Customer shifts to open-source pose churn risks. Recession or rate hikes add economic drag.
Market Sentiment & Investor Psychology
Short interest low at under 2% of float. Options show call volume outpacing puts 1.5:1. Institutional ownership steady at 50%+, retail piling in via apps.
Behavior tilts momentum bias over value. Sentiment reads neutral to optimistic, not euphoric.
Short-Term Outlook
Technicals suggest bounce from support at 592. Momentum fades but volume stabilizes. Expect sideways trade next weeks barring Fed news.
Medium to Long-Term Outlook
Strong business models in AI, cloud favor QQQ ETF. Industry growth at 15%+ CAGR aids. Financial health robust, risks from valuation stretch.
Long-term investors should hold or accumulate on weakness. Tech dominance persists.
FAQ
Is QQQ ETF a buy right now?
Yes for long-term, on dips near support; short-term hold amid volatility.
What is the price target for QQQ ETF?
Analyst average 650-700 by year-end 2026.
What are major risks for QQQ ETF?
Tech concentration, growth slowdowns, rates.
QQQ ETF forecast for 2026?
Modest gains to 10-15% if AI delivers.
Suggestions
Compare with SOXS ETF analysis
See our Nasdaq-100 forecast
Read tech sector outlook 2026
Conclusion
Hold QQQ ETF for growth exposure. Upside from tech leaders offsets near-term wobbles. Balanced view favors patience over trades.
Buy / Hold / Watchlist: Hold
Disclaimer: This article is for informational purposes only and not financial advice.