
TQQQ ETF analysis with price trend, technicals, earnings context, analyst sentiment, risks, and outlook for investors.
Data as of April 20, 2026, 8:02 AM PKT — latest market data used was the most recent available market close and related published fund data.
Introduction
The TQQQ ETF is a leveraged fund that seeks to deliver three times the daily performance of the Nasdaq-100 index. Because of that structure, it attracts active traders who want amplified exposure to U.S. growth and tech stocks. The TQQQ ETF has been under close watch as large-cap technology remains a major driver of market direction.
Investors are focused on this TQQQ ETF because tech leadership, interest-rate expectations, and volatility all affect leveraged products more than plain index funds. When the Nasdaq-100 rises quickly, TQQQ can move sharply higher. When the market turns risk-off, losses can also compound quickly.
Latest etf Price & Trend
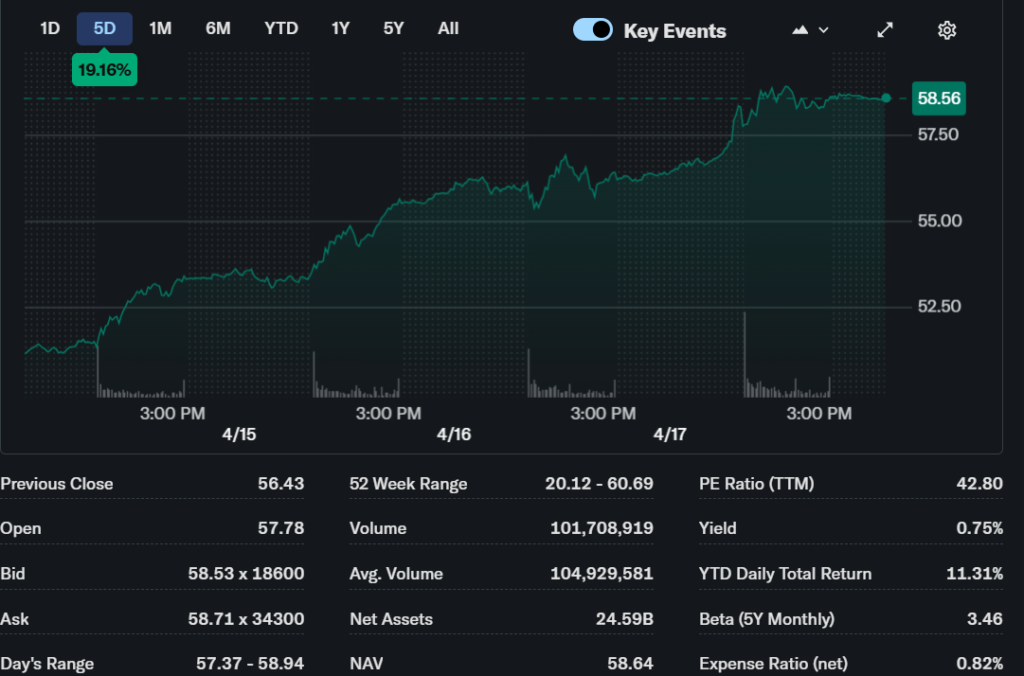
The latest available TQQQ ETF price was about $119.09, and it was reported as up 2.28% over the day in one recent market snapshot. Over the past month, the fund showed a 17.80% gain, while its yearly performance was up 56.31% in the same source. Another fund summary showed a 52-week range of roughly $35.00 to $121.37, which places the ETF near the upper end of its recent trading band.
The broader trend looks bullish based on those figures. That said, the ETF’s design makes trend changes fast and violent, so investors should treat strength with caution. For buyers, the message is simple: momentum has been positive, but leverage can reverse that picture quickly.
Technical Analysis
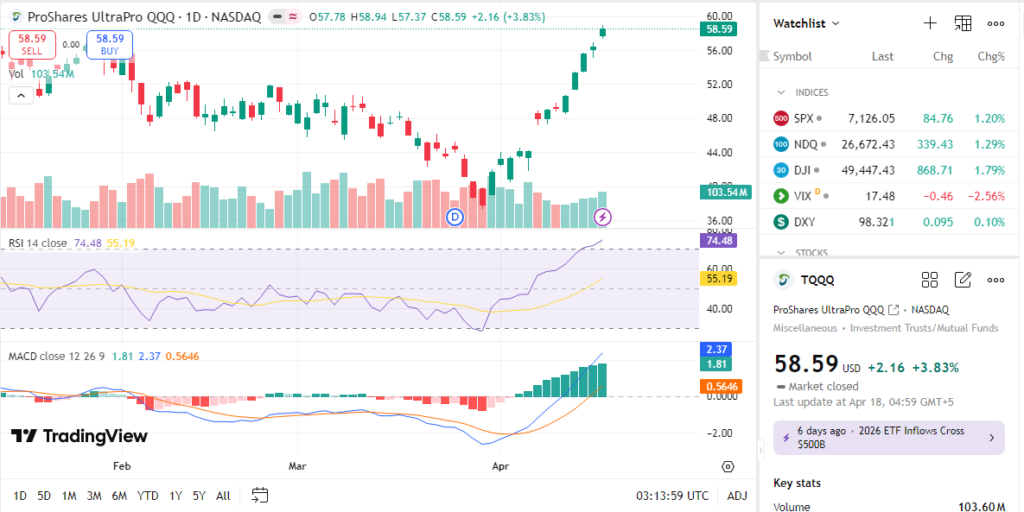
Support is the price area where buyers often step in, while resistance is where sellers may become more active. Recent technical summaries showed TQQQ trading above several moving averages, including the 10-day, 20-day, 30-day, 50-day, and 100-day averages, which usually signals a strong short-term trend. A strong-buy technical rating was also reported in one market summary.
The 50-day and 200-day moving averages matter because they help show the medium- and long-term trend direction. When price stays above these averages, traders usually see that as a positive sign. A golden cross happens when the 50-day average rises above the 200-day average, while a death cross is the opposite; I could verify the moving-average bias, but not a confirmed crossover from the available source set. Volume also matters because rising volume during an uptrend often confirms buyer interest, and one market snapshot showed heavy trading volume of 61.33 million shares.
RSI and MACD are useful momentum tools, but I could not verify a current RSI or MACD reading from the accessible sources. For beginners, RSI measures whether price may be overbought or oversold, while MACD helps show whether momentum is turning up or down. Based on the available trend data, the ETF looks more stretched to the upside than neutral, so traders should expect larger swings than with a standard index ETF.
Analyst Ratings & Price Targets
Formal analyst price-target coverage is limited for leveraged ETFs like TQQQ because it is a fund, not operating company stock. Unlike a business with earnings estimates, the TQQQ ETF mainly tracks the Nasdaq-100 with 3x daily leverage, so Wall Street firms usually focus more on the index itself than on target prices for the fund. That means the usual buy/hold/sell and target-price framework does not fit TQQQ well.
For investors, this matters because analyst sentiment is less useful here than for individual stocks. The better guide is the trend in the underlying Nasdaq-100 and the market environment around rates, AI, and mega-cap tech. In other words, TQQQ forecast work is mostly a macro and momentum exercise, not a standard analyst-target exercise.
Insider Activity
Insider activity does not work the same way for an ETF as it does for a company. TQQQ does not have corporate insiders buying or selling shares based on company operations, executive compensation, or insider trading patterns. Instead, the most relevant flows are fund creations, redemptions, and investor demand.
One fund summary showed one-year fund flows of about negative $7.09 billion, which suggests meaningful outflows over that period. That does not automatically mean investors are bearish, because leveraged ETFs are often traded tactically. Still, sustained outflows can signal caution after a strong run.
Valuation Analysis
Traditional valuation ratios such as trailing P/E, forward P/E, price-to-sales, revenue growth, and free cash flow do not apply cleanly to the TQQQ ETF itself, because it is not an operating business. One research dashboard listed a P/E ratio of 0 and did not present normal company-style revenue metrics, which is expected for a fund structure. Debt and cash position also do not work like they do for a corporation, since the ETF’s main purpose is index exposure, not running a business balance sheet.
Because of that, TQQQ is not fairly valued or undervalued in the usual stock sense. It is better judged by price action, tracking behavior, fees, leverage decay, and market conditions. Compared with stocks such as Microsoft or Zoom, the ETF should not be measured by earnings multiples at all; it should be measured by whether the trader wants amplified Nasdaq-100 exposure.
Recent Earnings & Catalysts
The TQQQ ETF does not report company earnings in the normal sense, so there is no quarterly revenue beat, EPS beat, or management guidance to analyze. When investors search for TQQQ earnings, they are usually really asking about the earnings of the Nasdaq-100 companies that drive the fund. In practice, the biggest catalysts are mega-cap tech results, Fed policy shifts, AI spending themes, and broad risk appetite.
The ETF tends to respond strongly when the largest Nasdaq names report strong numbers or when markets price in easier financial conditions. It can also rise on renewed optimism around artificial intelligence, cloud demand, and software spending. Because leverage magnifies the move, even a modest change in sentiment can have a noticeable effect on the TQQQ ETF price.
Bullish Case
The main bullish case is simple: the Nasdaq-100 remains home to many of the market’s strongest growth franchises. If large tech names continue to beat earnings estimates and the market keeps rewarding growth, TQQQ can outperform quickly because of its 3x daily structure. Strong technical momentum also supports the case, since the ETF has been trading above key moving averages in recent readings.
Another positive factor is market demand for concentrated growth exposure. When investors want more upside than a plain index ETF can offer, leveraged funds often attract attention. That said, the upside case works best when the trend is persistent and volatility stays contained.
Bearish Case
The biggest risk is leverage itself. Daily compounding can hurt performance during choppy or sideways markets, even if the Nasdaq-100 ends up flat over time. That makes TQQQ much riskier than a standard ETF, especially for investors who hold through volatility without a plan.
Other risks include higher interest-rate pressure, valuation compression in growth stocks, and sudden pullbacks in mega-cap tech. Fund flows also suggest the product can see sharp swings in investor demand. For long holds, the ETF can be difficult to manage because losses can accelerate fast during market stress.
Market Sentiment & Investor Psychology
Short interest is not very meaningful in the same way it is for a single stock, because TQQQ is an ETF tied to a major index strategy. Options activity can matter more, but I could not verify a current calls-versus-puts breakdown from the available sources. Institutional ownership is also less informative here than for an operating company.
The broader mood appears optimistic but cautious. Recent strength, heavy volume, and positive trend readings point to bullish sentiment, while the fund’s leverage keeps many investors careful. Retail traders often like TQQQ for momentum, but that same crowd can exit fast when volatility spikes.
Short-Term Outlook
Over the next days or weeks, TQQQ forecast expectations depend mostly on Nasdaq-100 momentum and volume. If tech leadership stays strong, the ETF can continue to trade well above its key moving averages. If the market turns risk-off, however, the fund can drop faster than the underlying index.
The short-term setup still leans constructive, but it is not low risk. The recent trend strength suggests buyers remain active, yet the leverage means traders should respect support and resistance closely. This is a momentum trade, not a buy-and-forget instrument.
Medium to Long-Term Outlook
Over 6 to 24 months, the best case for TQQQ is a durable bull market in large-cap technology. The fund works best when the Nasdaq-100 trends upward for long stretches and volatility stays manageable. If that happens, the ETF can remain a powerful tactical tool for aggressive investors.
For long-term investors, the key question is not just return potential, but risk tolerance and holding discipline. Because of daily leverage, TQQQ is better suited to active traders or very experienced investors who understand path dependence. For most investors, the best stance is watch or use only a small, tactical allocation.
FAQ Section
Is TQQQ ETF a buy right now?
It can be attractive for traders who expect continued Nasdaq-100 strength, but it is not suitable for everyone. The current trend is positive, yet the ETF remains highly volatile.
What is the price target for TQQQ ETF?
A normal price target is not meaningful for TQQQ because it is a leveraged fund, not a company stock. Traders should instead watch the Nasdaq-100 trend, moving averages, and volume.
What are the major risks for TQQQ ETF?
The main risks are leverage decay, sharp drawdowns, and strong losses in volatile or sideways markets. Rate pressure and tech-sector weakness can also hurt performance.
What does TQQQ ETF earnings mean?
TQQQ itself does not have earnings like a company. Investors usually use that phrase to mean the earnings of the large Nasdaq-100 companies that drive the ETF.
Is TQQQ ETF a long-term hold?
It is usually better as a tactical trading tool than a core long-term holding. Long-term investors should be cautious because daily leverage can work against patient holders.
Suggestions
- Compare with Zoom ETF.
- See our Microsoft ETF forecast.
- Read our tech sector valuation breakdown.
Conclusion
The TQQQ ETF looks technically strong and trend-supported, but it remains a high-risk leveraged product. For active traders, it can be a useful momentum vehicle when tech is strong. For most long-term investors, the better label is watchlist rather than core buy.
Disclaimer: This article is for informational purposes only and not financial advice.