

PLTD Technical Analysis: Trend, Levels & Outlook March 2026
Direxion Daily PLTR Bear 1X ETF (PLTD) is an inverse exchange-traded fund designed to deliver the opposite daily performance of Palantir Technologies stock. Unlike leveraged inverse ETFs that amplify moves, PLTD aims to provide a 1x inverse exposure, meaning it generally rises when Palantir shares fall and declines when Palantir rises. The ETF belongs to the single-stock inverse ETF sector, which has grown in popularity as traders look for tools to hedge or speculate on individual company movements.
Traders are watching PLTD closely in March 2026 as Palantir remains one of the most talked-about artificial intelligence and data analytics companies in the market. The stock has experienced strong rallies fueled by AI demand but also periodic corrections due to valuation concerns and broader tech sector volatility. This article explores PLTD’s current price trend, important support and resistance levels, and key indicators such as RSI, MACD, and trading volume to help retail traders understand what the chart may be signaling during this period.

Current Price Trend in March 2026
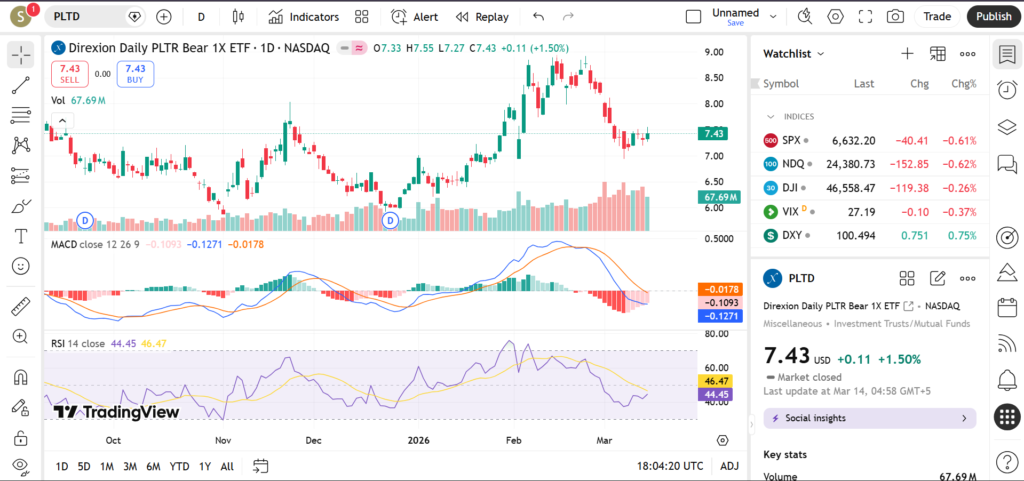
PLTD has been moving in a mixed short-term trend during March 2026, reflecting the fluctuating price action of Palantir stock itself. When PLTR rallies strongly, PLTD tends to decline as expected for an inverse ETF. Conversely, during periods of technology sector weakness or profit-taking in AI stocks, PLTD can experience quick upward moves.
Looking at the moving averages, the 20-day moving average has recently been acting as short-term dynamic resistance. Because PLTD has faced downward pressure while PLTR remains strong, the ETF has struggled to maintain upward momentum above this average.
The 50-day moving average provides a broader view of the intermediate trend. PLTD has moved around this level during the past several weeks, indicating a market that is still searching for direction. Traders often watch this average carefully because repeated failures to reclaim it could signal continued weakness for the ETF.
Meanwhile, the 200-day moving average remains an important long-term reference level. Inverse single-stock ETFs often spend extended periods trending downward when the underlying stock performs well. If PLTD approaches this longer-term average, traders will likely watch closely to see whether sellers appear again.
Recent price action shows lower highs forming during brief rallies, suggesting that bearish pressure has been dominant recently. However, the ETF has also shown occasional sharp spikes when Palantir stock experiences sudden pullbacks.
Key Support and Resistance Levels
Key support and resistance zones help traders identify where buying or selling activity may emerge.
Support Levels
The first support area for PLTD appears near the most recent swing low, which formed during the latest rally in Palantir stock. This level has acted as a temporary floor for the ETF in recent sessions.
Another support zone lies near the lower boundary of the current trading range, where buyers have stepped in previously during periods of tech sector volatility.
A deeper support region may appear near longer-term lows, which historically have acted as stabilization points for inverse ETFs when the underlying stock experiences extended rallies.

Resistance Levels
On the upside, the first resistance area is located near the recent swing high formed during Palantir’s latest pullback. This level previously attracted sellers once PLTR resumed its upward movement.
Another resistance zone sits near the 50-day moving average, which may act as dynamic resistance unless momentum shifts in favor of PLTD.
A stronger resistance region could appear near the 200-day moving average, where longer-term traders may evaluate whether the ETF can sustain a recovery.
A breakout above these resistance levels might indicate increased bearish pressure on Palantir shares, while failure to break them could suggest continued downward pressure for the ETF.
Indicators – RSI, MACD, Volume
The Relative Strength Index (RSI) for PLTD has been moving mostly between the neutral and oversold zones. This pattern reflects the overall downward pressure experienced by the ETF while Palantir stock has maintained relatively strong momentum.
The MACD indicator has shown mixed signals in recent sessions. Periodic bullish crossovers occur when PLTR temporarily declines, but these signals often fade once Palantir resumes its upward trend.
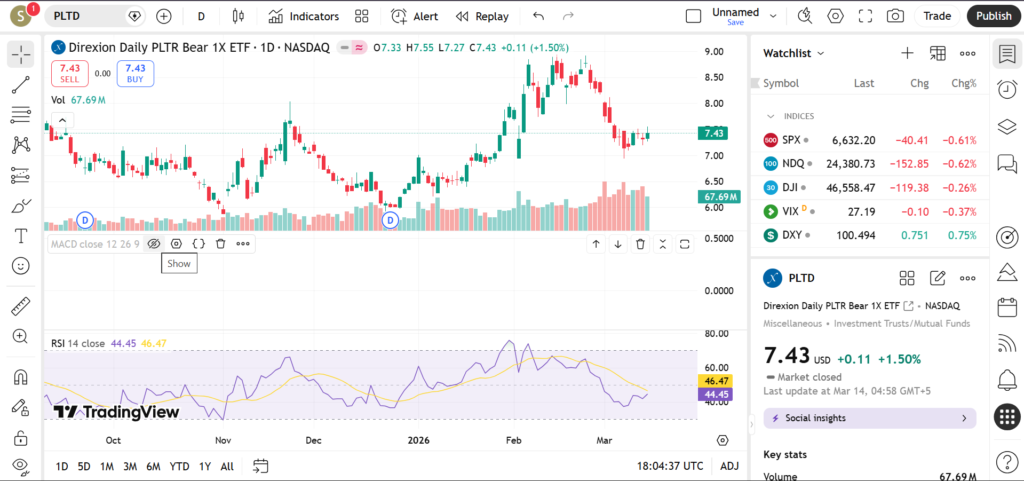
Volume behavior also provides useful insights. Volume spikes in PLTD frequently coincide with sharp declines in Palantir stock, as traders rush to hedge or speculate on short-term corrections. During calmer market periods, volume tends to decline as trader activity slows.
Short-Term Outlook for PLTD in March 2026
The technical outlook for PLTD in March 2026 remains closely tied to the performance of Palantir stock. As long as the broader technology sector and AI-related companies maintain strength, PLTD may continue experiencing downward pressure.
However, temporary corrections in Palantir shares could trigger quick but short-lived rallies in the ETF. These movements often occur rapidly due to the inverse relationship between the ETF and the underlying stock.
What traders are watching:
• Palantir price movements and AI sector sentiment
• Breakout above resistance during tech pullbacks
• RSI shifting from oversold toward neutral levels
• Volume spikes indicating increased hedge activity
• Earnings announcements or government contract news affecting PLTR
Risks and Important Notes
Technical levels in inverse ETFs can fail quickly because they are highly dependent on the movement of the underlying stock. Sudden company-specific news, earnings surprises, or broader technology sector shifts can lead to rapid price changes.
PLTD is designed primarily for short-term trading strategies rather than long-term investment, as inverse ETFs can behave differently over extended periods due to daily rebalancing effects.
This analysis is intended for educational purposes only and should not be interpreted as financial advice.
For broader context, traders may also review technical analysis for Palantir stock, AI sector ETFs, or major technology ETFs to better understand market sentiment.