

Explore Opendoor Technologies (OPEN) stock price, earnings, technical analysis, and forecast. Is OPEN stock a buy? Get balanced insights on valuation and outlook as of March 2026.
Introduction
Opendoor Technologies runs an online platform to buy and sell homes fast. It lets sellers get instant offers and close quickly without showings. Investors watch OPEN stock now amid housing market shifts and interest rate cuts. Broader market conditions like cooling inflation help real estate tech stocks recover.
Latest Stock Price & Trend
OPEN stock closed at $5.38 per share on the last market session. It rose 1.6% in the day from $6.85 low to $6.96 high, but settled lower amid volatility. Over five days, it gained 8.4% with higher volume signaling interest.
The one-month trend shows a 2.87% dip as 20-day moving average sits at $4.86. Three months reflect a 16.23% drop versus 50-day average of $5.72. Six months align with 33.17% decline from 100-day average of $6.61. Year-to-date, it’s down 7.03% against $5.59 average.
52-week high reached around $10.87, low near $0.50, per historical data. Overall trend leans bearish short-term but with bullish long-term 200-day average crossover at +666% gain. This suggests caution for short holds but potential rebound for patient investors in recovering housing.
Technical Analysis
Support levels hover near $4.86 (20-day MA) where buyers may step in. Resistance sits at $5.72 (50-day MA), blocking upside moves. RSI at 14-day 75.94% nears overbought, warning of pullback risk; below 30 signals oversold buys.

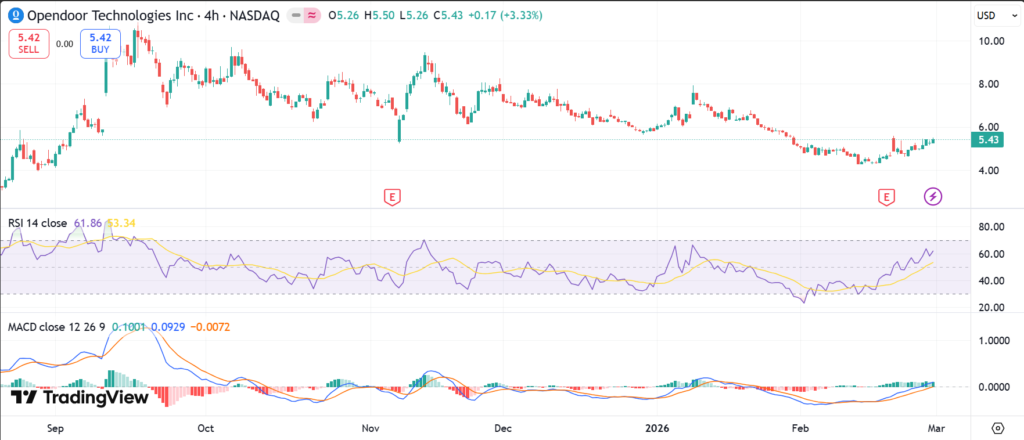
MACD trend shows positive direction (+DI 24.20%) over negative, hinting bullish momentum. 50-day MA ($5.72) above 200-day ($4.87) forms golden cross, a buy signal for uptrends. Trading volume trends up to 52M daily average, confirming interest.
These indicators matter as they spot entry/exit points. Beginners use them to avoid emotional trades.
Analyst Ratings & Price Targets
Four analysts rate OPEN as Sell consensus. No Buys, mostly Holds turned Sell. Average price target $1.45-$1.67, high $2.50, low $0.70, implying 70-80% downside.
Recent downgrades include Keefe Bruyette to Sell at $1 (Aug 2025), Citigroup to Strong Sell at $0.70. UBS holds at $1.60. Wall Street sees housing headwinds. This bearish sentiment urges investors to wait for proof of profitability.
Insider Activity
Insiders show net selling. Megan Meyer sold 46K shares at $2.59 (Mar 2024), Sydney Schaub 2.5K at $2.81. Recent 6 transactions: 1 sale worth $320K, 5 awards.
Trends lean cautious as management trims holdings amid volatility. Insider ownership at 7.12% signals some confidence but sales imply profit-taking. Watch for buys as bullish sign.
Valuation Analysis
Trailing P/E negative at -3.52 to -15.33 due to losses. Forward P/E unavailable. Price-to-Sales 1.27, below industry 3.13 average. Revenue TTM $4.37B, down 15.2% YoY; Q3 $915M, Q4 $736M.

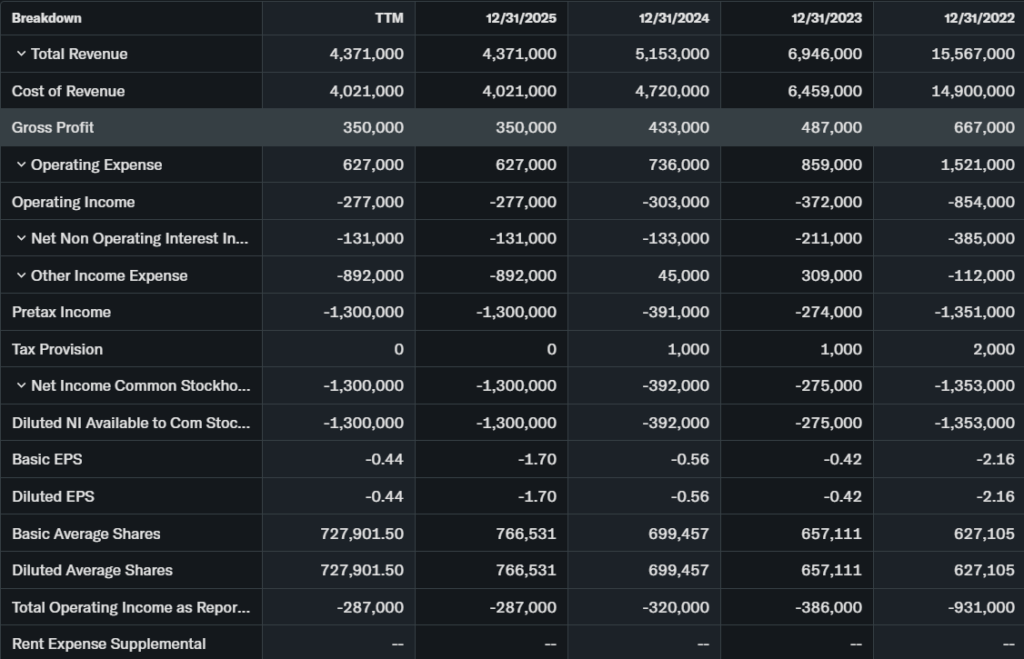

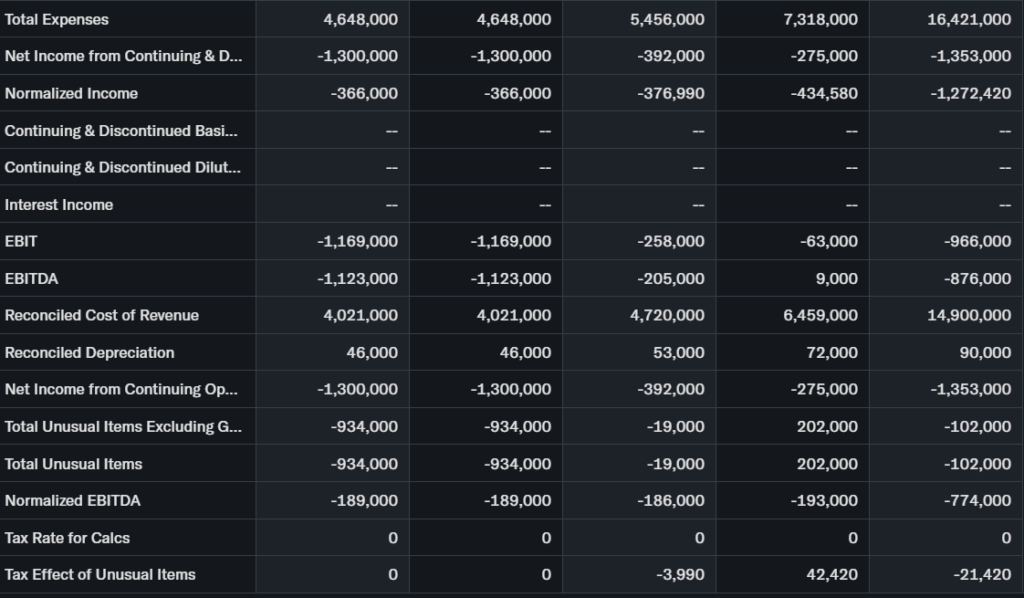
EPS -$1.70 TTM, Q4 -$0.07 beat estimates. Free cash flow negative; debt high but cash $801M equity. Vs peers like Zillow, OPEN trades cheaper on sales but riskier on losses. Stock appears undervalued on growth potential if housing rebounds, but fairly valued given risks.
Recent Earnings & Catalysts
Q4 2025 revenue $736M missed $1.08B prior year but homes bought +46% QoQ. EPS -$0.07 beat -$0.10 estimate by 30%. Q3 revenue $915M, gross profit $66M, net loss $90M.
Forward guidance eyes “Opendoor 2.0” with AI tools, better velocity. Catalysts: 12+ AI products, new CEO roadmap for scale. Earnings beat sparked short rally but stock dipped on revenue miss, showing sensitivity to housing data.
Bullish Case
Revenue could rebound with lower rates boosting buys. Homes purchased up 46%, days in possession down 23%. AI integrations cut costs, improve matching. Operational leverage from Opendoor 2.0 targets profitability.
Market demand grows as iBuyers gain trust post-Zillow pause. Tech edges traditional agents.
Bearish Case
Competition from Zillow, Redfin squeezes margins. Revenue down 15-40% YoY signals slowing growth. Net losses persist at $1.3B TTM, inventory $1.05B risk in downturns. Regulatory scrutiny on iBuyers and high rates linger. Economic slowdown hits housing.
Market Sentiment
Short interest 14.48% of float, 3.48 days to cover, bearish bet. Institutional ownership 49.43%, steady. Off-exchange short volume 48.67%. Retail chases momentum but analysts neutral-to-bear.
Sentiment neutral, leaning fearful on valuation gaps.
Short-Term Outlook
RSI overbought, volume up but below 50-day MA tests support. Momentum fades if housing data weakens. Expect sideways trade next weeks unless volume surges.
Medium to Long-Term Outlook
Strong model in digital real estate, industry grows 5-10% yearly. Competitive moat via AI, but peers challenge. Financials improve with leverage, yet losses worry. Hold for recovery; accumulate on dips if earnings turn positive. Watchlist now.
FAQ
Is OPEN stock a buy right now? Analysts say Sell; wait for profitability proof.
What is the price target for OPEN stock? Average $1.67, range $0.70-$2.50.
What are major risks for OPEN stock? Revenue drops, housing slowdown, competition.
What is OPEN earnings outlook? Next EPS est. -$0.07; focus Q1 homes sold.
OPEN stock forecast long-term? Potential if rates fall, but bearish near-term.
Suggestions
Compare with DELL stock analysis
See our Redfin stock forecast
Read our real estate tech valuation
Final Balanced Conclusion
Watchlist OPEN stock. Bearish analysts and trends offset earnings beats and cheap valuation; hold if owned, avoid new buys until housing stabilizes.
Disclaimer: This article is for informational purposes only and not financial advice.